

Census Bureau: Businesses lease cars, office space, furniture and workers
Number of Workers of Employee Leasing Firms Soared 686% From 1992 to 2017
Andrew W. Hait
Since the industrial revolution, businesses have strived to streamline operations to maximize employee productivity and minimize costs. They embraced automation, a popular way to modernize workflows and production processes, but it was not enough.
Enter California businessman Marvin R. Selter, who in the late 1960s popularized a concept that gave businesses a way to avoid employment taxes and other costs: lease — not hire — employees.
How would it work? Leasing firms would provide the leased workforce and handle all the human resources, payroll, and employee benefit functions for the client, but the client would still maintain day-to-day management of the workers.
Employee leasing became especially valuable to businesses with large seasonal swings in employment.
The concept took off. Between 1992 and 2017, the number of people working for employee leasing firms skyrocketed 682% from 341,884 to 2.7 million.
Employee leasing became especially valuable to businesses with large seasonal swings in employment.
If they hired rather than leased workers, they would have to lay them off when business was slow and bring them back when it picked back up. A leased worker, however, could be leased for a set period.
Employee leasing also became valuable to small- and medium-sized businesses that could not provide worker benefits on their own.

Contractors can be classified as leased employees or temporary employees. How they’re counted depends on how the worker is managed day-to-day and whether the business that hires them pays for the worker’s benefits.
Growth in Employee Leasing
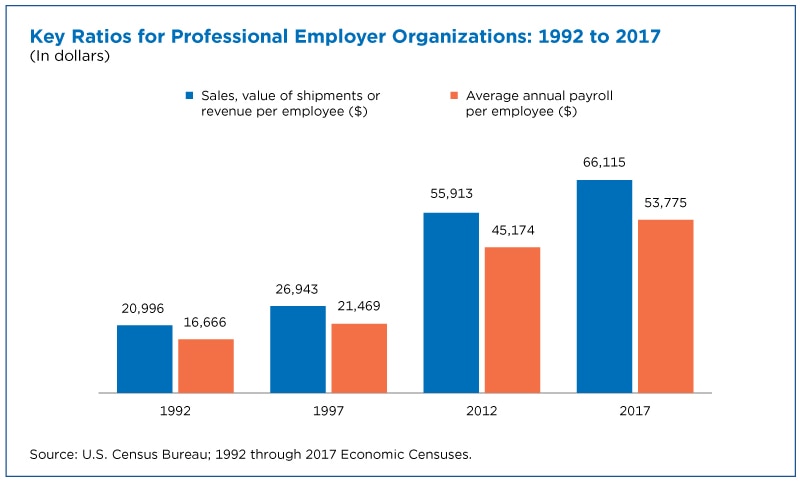
According to the 1992 Economic Census, there were 2,241 “Employee Leasing” establishments — now called Professional Employer Organizations (PEOs) — with 341,884 employees in 1992.
These PEO businesses had an annual payroll of $5.7 billion (an average of $16,666 per employee) and generated $7.2 billion in revenue.
While the number of establishments rose to 4,766 in 1997 and decreased to 3,769 in 2017, the employment, payroll, and revenue of these PEOs soared.
In 2017, PEOs employed 2.7 million workers with $144.6 billion in annual payroll (an average of $53,775 per employee). Their revenue grew to $177.8 billion, with each employee generating $66,115 in revenue for the PEO, up from $20,996 in 1992.
.
.
Profile of the Nation’s PEOs
The Economic Census provides information on Professional Employer Organizations every five years and other Census Bureau programs such as the annual County Business Patterns (CBP) offer it more frequently.
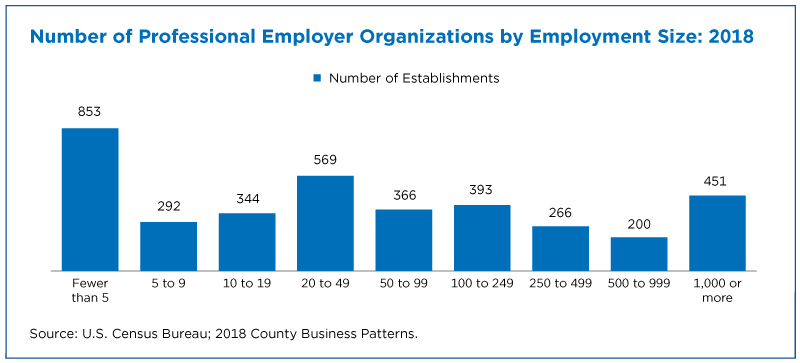
CBP, for example, showed that there were many small PEOs in 2018 but that large organizations made up the bulk of those businesses: 451 PEOs with more than 1,000 employees had 88% of the 3 million employees in this industry on their payroll.
.
.
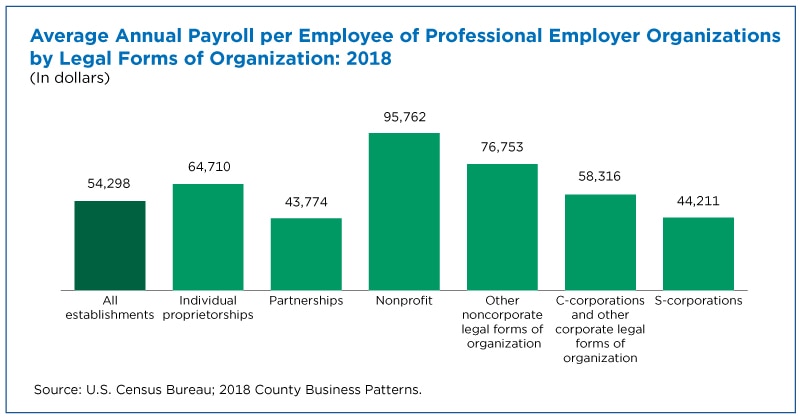
Most of these PEOs — just over 2.7 million — were organized as corporations and employed the most workers in 2018.
However, the 46 nonprofit PEOs (typically worker advocacy firms) actually reported higher average annual payroll per employee: $95,762 for nonprofits versus $58,316 for C-corporations (a type of corporate legal form of organization).
.
.
Leased Employees Are Counted Differently
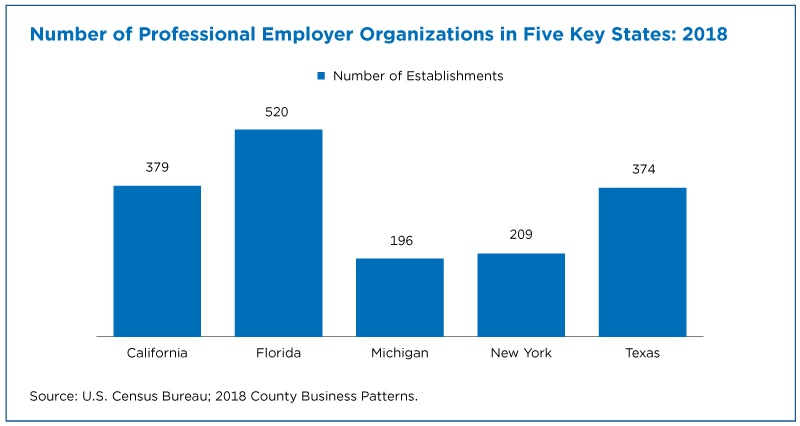
California led the nation in the total number of employer establishments, but Florida is actually ranked first in PEOs in 2018.
Florida’s 520 PEOs that year employed nearly 1.3 million workers and reported annual payroll of $62.5 billion, an average of $49,240 per employee.
But these workers may not have worked in Florida at all.
It’s important to note that the three million PEO employees in 2018 included not only the actual employees of the PEOs but also the workers they “leased” to their clients.
.
In Census Bureau programs, leased workers are counted in the state where the PEO is physically located, which may or may not be the state where the business they physically work for is located.
This is because (for tax purposes) these workers are considered employees of the PEO that pays them and provides benefits, including administration fees like the employer’s share of FICA, Medicare and unemployment insurance withholdings.
Census Bureau employment and payroll data for hundreds of industries these PEOs place workers in typically only include the businesses’ own – not leased – employees.
The only exception is the rare instance in which all the employees of a business are leased. In these cases, the business would report leased employees as their own.
In Census Bureau programs, the client business would only report the cost of their contract with the PEO, which includes wages paid to the workers as well as the PEOs’ own administrative expenses and profit.
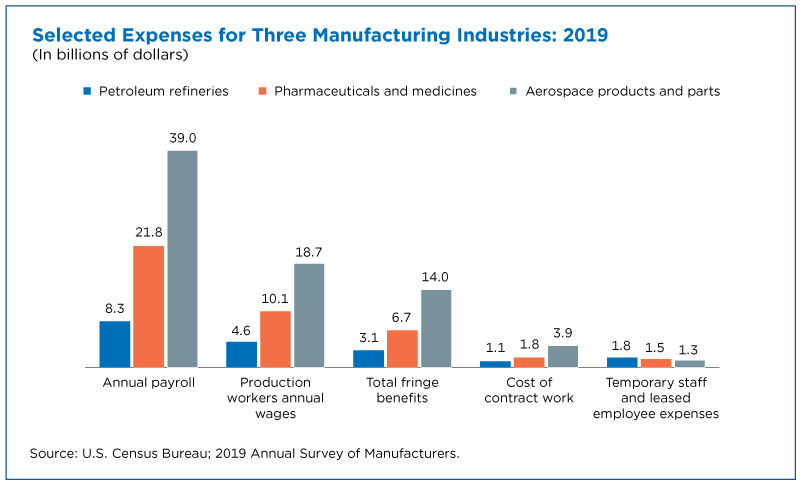
The figure below shows some of the expense data for three industries published in the Annual Survey of Manufactures (ASM), a Census Bureau survey that provides data on industries that often rely on leased employees.
For example, while petroleum refineries spent $8.3 billion in 2018 on annual payroll for their own employees, they spent an additional $1.8 billion on temporary and leased employee expenses.
.
.
Who’s Leased and Who’s Not?
So, how can data users figure out which workers are leased?
Answer: The Bureau of Labor Statistics.
The BLS Quarterly Census of Employment and Wages (QCEW) provides counts of employment and wages reported by employers at the worksite level.
QCEW collects data on PEO employees who work where the PEO is located as well as leased employees who work at each PEO client worksite.
PEO worksites are reported at the PEO’s geographic location. Client worksites are reported under the industry and geographic location where the client conducts its primary economic activity. This enables these worksites to stay in the correct industry and location as they move leased workers around.
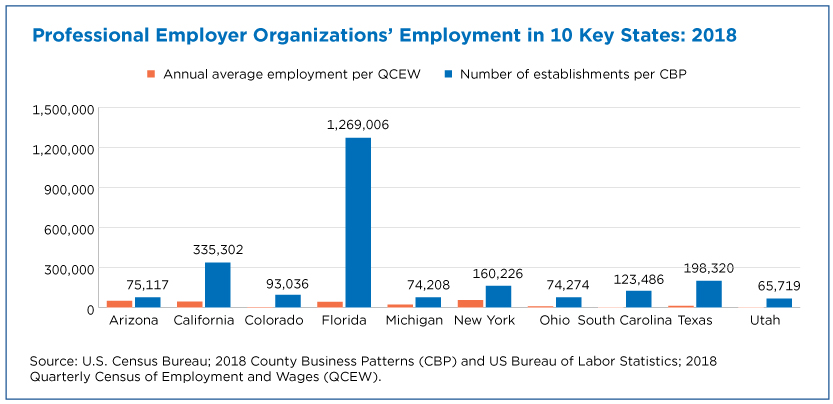
Comparing Census Bureau and QCEW data offers a glimpse into just how many PEO employees (as reported in Census Bureau programs) are workers that PEOs lease to clients.
That’s why in 2018, PEOs reported just over three million employees to the CBP but only 377,749 employees to the QCEW.
This difference is especially noticeable in Florida’s PEO data, but it also applies to nearly every other state. For example, PEOs in California reported nearly 335,302 employees to the CBP but only 43,759 employees to the QCEW.
.
We would see a similar gap if we were to compare the CBP and QCEW data for the hundreds of industries where PEOs place workers.
Some of the differences may be due to statistical error but the BLS and Census Bureau also count the workers differently.
Which Data Should We Use?
If you want to count only “true” employees of a business, the Census Bureau data would be the “better” data source.
Doing so would obviously impact productivity measures, as these leased workers contribute to the revenue of the business but aren’t counted in the employment data. But the contract expense data that is often provided give a glimpse into how significant this might be.
If, however, you want to count all of the workers of a business (regardless of whether they are a “regular” or leased employee) in the industry and geography in which they work, the BLS data may be a “better” source.
This would overstate the actual employment and wages of the business the leased employees work in and understate the true workforce employed by PEOs.
Merging the two data sources provides insight into just how important this employment practice has become to American businesses.
Early adopters of the leased employee concept might be amazed by the growth of PEOs and how both the businesses that utilized leased employees and the leased employees themselves have benefited from it.
Notes: All dollar values are expressed in current dollars, i.e., they are not adjusted for price changes. All Census Bureau employment data is for the pay period including March 12.
Andrew W. Hait is a survey statistician/economist at the Census Bureau.


