

Hays County, local municipalities receive over $8.1 million in combined June sales tax revenue, down $1.2 million from May
Corridor Staff
For June, Hays County local municipalities received over $8.1 million in combined monthly sales tax revenue. That’s down from May by $1.2 million.
According to the comptroller’s website, Hays County and the local government municipalities received $49,646,390.98 million combined total year to date (January-December 2021) in sales tax revenue payments.
Sales taxes are a primary source of funds for many vital services ranging from police and fire protection to parks, recreation, library, environmental services, planning, and more.
The reliance on sales tax revenue requires vigilant monitoring of revenue sources to ensure they will keep pace with the demands and rising costs while operating large complex budgets.
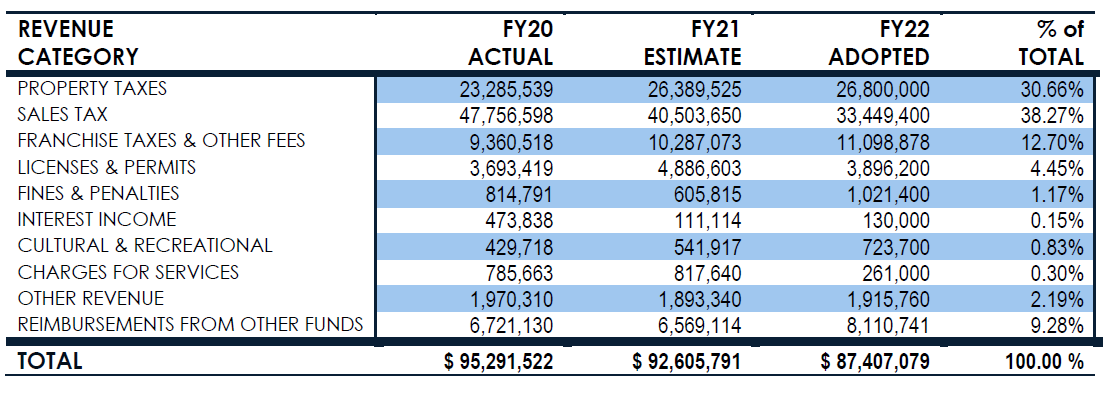
In the City of San Marcos, sales tax revenues represent 38.27% of the general fund budget. They are the largest single revenue source supporting general government services, which is the same for nearly all cities across the state.
You can review more on the San Marcos budget, spending, and where your tax money goes below.
.

• MONTHLY COUNTY & MUNICIPAL RUNDOWN •
.
JUNE 2022 SALES TAX REVENUE
Local Central Texas Cities: $5,707,292.96
Hays County: $2,481,553.07
Combined Total: $8,188,846.03
These allocations are based on sales made in April by businesses that report tax monthly.
•
MAY 2022 SALES TAX REVENUE
Local Central Texas Cities: $6,617,453.78
Hays County: $2,821,557.96
Combined Total: $9,439,011.74
*These allocations are based on sales made in March by businesses that report tax monthly.
COMBINED YEAR TO DATE SALES TAX REVENUE
Local Central Texas Cities: $34,638,343.31
Hays County: $15,008,047.67
Countywide Combined Total: $49,646,390.98
*Year To Date: January-December calendar year
• MONTHLY COUNTY & MUNICIPAL BREAKDOWN •
Can’t see the whole table? Touch it and scroll right!
| CITY | RATE | NET PAYMENT THIS PERIOD | COMPARABLE PAYMENT PRIOR YEAR | % CHANGE |
PAYMENT YTD | PRIOR YEAR PAYMENT YTD | % CHANGE |
| BUDA | 1.50% | $879,284.43 | $852,153.73 | 3.18% | $5,800,635.17 | $4,976,113.99 | 16.56% |
| DRIPPING SPRINGS | 1.25% | $371,263.01 | $322,931.85 | 14.96% | $2,086,370.07 | $1,780,363.07 | 17.18% |
| HAYS | 1.00% | $1,470.93 | $1,518.23 | 3.11% | $13,027.37 | $11,002.69 | 18.40% |
| KYLE | 1.50% | $1,213,710.13 | $1,041,879.82 | 16.49% | $7,290,408.82 | $5,858,533.59 | 24.44% |
| MOUNTAIN CITY | 1.00% | $2,201.35 | $2,214.94 | 0.61% | $12,830.80 | $12,483.27 | 2.78% |
| NIEDERWALD | 1.00% | $7,970.36 | $6,624.22 | 20.32% | $42,362.83 | $34,473.55 | 22.88% |
| SAN MARCOS | 1.50% | $3,030,338.79 | $2,730,852.89 | 10.96% | $18,238,716.49 | $21,705,896.76 | 15.97% |
| UHLAND | 1.50% | $83,388.82 | $56,006.21 | 48.89% | $406,317.62 | $286,097.34 | 42.02% |
| WIMBERLEY | 1.00% | $110,614.55 | $103,888.15 | 6.47% | $702,324.31 | $599,431.89 | 17.16% |
| WOODCREEK | 1.00% | $7,050.59 | $6,987.08 | 0.90% | $45,349.83 | $43,708.98 | 3.75% |
| HAYS COUNTY | 0.50% | $2,481,553.07 | $2,283,255.83 | 8.68% | $15,008,047.67 | $15,002,465.39 | 0.03% |
![]()
.
THE CITY OF SAN MARCOS 10-YEAR ANNUAL
SALES TAX COLLECTION & HOW IT’S USED
Sales taxes represent 38.27% of total General Fund revenue projected for fiscal year 2022.
Sales tax receipts are the largest single revenue source supporting general governmental services in San Marcos. Consistent retail sales have kept this revenue stream steady for several years.
When comparing historical sales tax collections by segment, the percentage represented by retail collections has decreased. In contrast, other segments have increased, indicating a negligible diversification in the sales taxes produced in the City.
It is important to note that sales tax revenues are a volatile funding source and subject to shifts in local, state, and national economies. Our reliance on this revenue source is approached with caution.
Any excess collection above the fiscal year 2022 estimate will go directly into the General Fund balance, or the budget can be amended to allocate these amounts.
SALES TAX COLLECTIONS – 10 YEAR
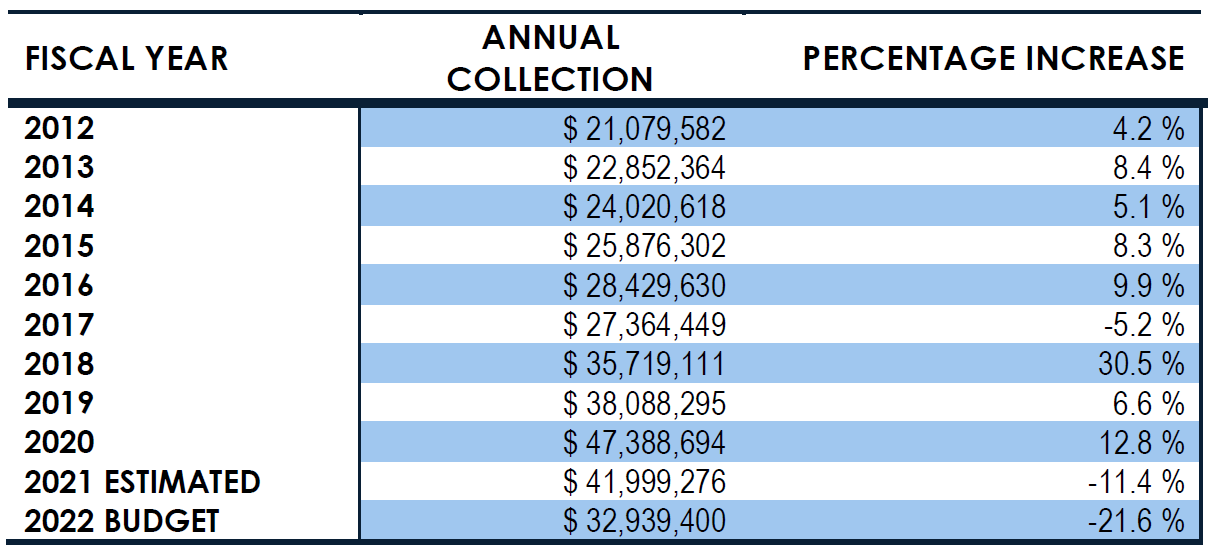
The City of San Marcos collects one and one-half cents on every dollar spent on taxable goods and services within the city limits.
The State of Texas allows home-rule cities like San Marcos to adopt a one-cent sales tax to support general governmental services.
Local voters authorized another half-cent in 1987 dedicated solely to reducing property taxes.
The one and one-half cents collected by the City represents the maximum they may adopt.
The half-cent sales tax alone is expected to generate $11,906,000 in the next fiscal year, a sum that is equivalent to 23.52 cents on the property tax rate.
According to the city, without the half-cent sales tax dedicated to property tax reduction, the city’s ad valorem tax rate would have to be 23.52 cents more, or 84.91 cents per $100 of assessed value, to support the programs and services provided to San Marcos residents.
.
GENERAL FUND REVENUE SUMMARY
![]()
.
• COSM FY 2021 – 2022 Approved Budget ![]()
• COSM FY 2020 – 2021 Approved Budget ![]()
• COSM FY 2019 – 2020 Approved Budget ![]()
• COSM FY 2018 – 2019 Approved Budget ![]()
• COSM FY 2017 – 2018 Approved Budget ![]()
• COSM FY 2016 – 2017 Approved Budget ![]()
• COSM FY 2015 – 2016 Approved Budget ![]()
• COSM FY 2014 – 2015 Approved Budget ![]()
• COSM FY 2013 – 2014 Approved Budget ![]()
• COSM FY 2012 – 2013 Approved Budget ![]()
![]()


