

Gov. Abbott Lands Number Five Spot On Cato’s 2018 Fiscal Policy Report Card On America’s Governors
The U.S. economy is in its 10th year of economic expansion, and state government budgets are benefiting from a solid growth in tax revenues. State general fund revenues have grown 40 percent since 2010. Many of the nation’s governors have used the growing revenues to expand spending programs, whereas others have pursued reductions in taxes.
That is the backdrop to this year’s 14th biennial fiscal report card on the governors, which examines state budget actions since 2016.
It uses statistical data to grade the governors on their taxing and spending records — governors who have cut taxes and spending the most receive the highest grades, whereas those who have increased taxes and spending the most receive the lowest grades.
Five governors were awarded an A on this report: Susana Martinez of New Mexico, Henry McMaster of South Carolina, Doug Burgum of North Dakota, Paul LePage of Maine and Greg Abbott of Texas.
Eight governors were awarded an F: Roy Cooper of North Carolina, John Bel Edwards of Louisiana, Tom Wolf of Pennsylvania, Jim Justice of West Virginia, Dennis Daugaard of South Dakota, David Ige of Hawaii, Kate Brown of Oregon, and Jay Inslee of Washington.
Governors of every state are having their fiscal choices shaped by the federal Tax Cuts and Jobs Act of 2017. State income tax bases are tied to the federal tax base, so governors have been considering which federal changes to conform to.
Also, the capping of the federal tax deduction for state and local taxes has increased the bite of those taxes for millions of households. The cap has increased the relative burden of living in a high-tax state, and it may induce higher out-migration from those states over time.

The state fiscal environment is also being shaped by recent Supreme Court decisions regarding online sales taxes and public-sector labor unions. Furthermore, the legalization of marijuana has created a new source of revenue for some states.
This report discusses these fiscal policy developments and examines the tax and spending actions of each governor in detail. The hope is that the report encourages more state policymakers to adopt the fiscal approaches of the top-scoring governors.
Introduction
Governors play a key role in state fiscal policy. They propose budgets, recommend tax changes, and sign or veto tax and spending bills.
When the economy is growing, governors can use rising revenues to expand programs, or they can return extra revenues to citizens through tax cuts.
When the economy is stagnant, governors can raise taxes to close budget gaps, or they can trim spending.
This report grades governors on their fiscal policies from a limited-government perspective.
Governors receiving an A are those who have cut taxes and spending the most, whereas governors receiving an F have raised taxes and spending the most.
The grading mechanism is based on seven variables, including two spending variables, one revenue variable, and four tax-rate variables. The same methodology has been used on Cato’s fiscal report cards since 2008.
The results are data-driven. They account for tax and spending actions that affect short-term budgets in the states.
However, they do not account for longer-term or structural changes that governors may make, such as reforms to state pension plans.
Thus, the results provide one measure of how fiscally conservative each governor is, but they do not reflect all the fiscal actions that governors make.
Tax and spending data for the report come from the National Association of State Budget Officers, the National Conference of State Legislatures, the Tax Foundation, the budget agencies of each state, and news articles in State Tax Notes and other sources.
The data cover the period January 2016 through August 2018, which was a time of budget expansion in most states.1 The report rates 43 governors. It excludes the governors of Alabama, Iowa, Kansas, Missouri, New Jersey, and Virginia because of their short time in office, and it excludes Alaska’s governor because of the peculiarities of that state’s budget.
The following section discusses the highest-scoring governors and the differences between governors of the two political parties. The section after that looks at recent developments that have affected state fiscal policy, including the 2017 federal tax law, recent Supreme Court rulings, and the legalization of recreational marijuana.
Appendix A discusses the report card’s methodology. Appendix B provides summaries of the fiscal records of the 43 governors included in the report.
Main Results
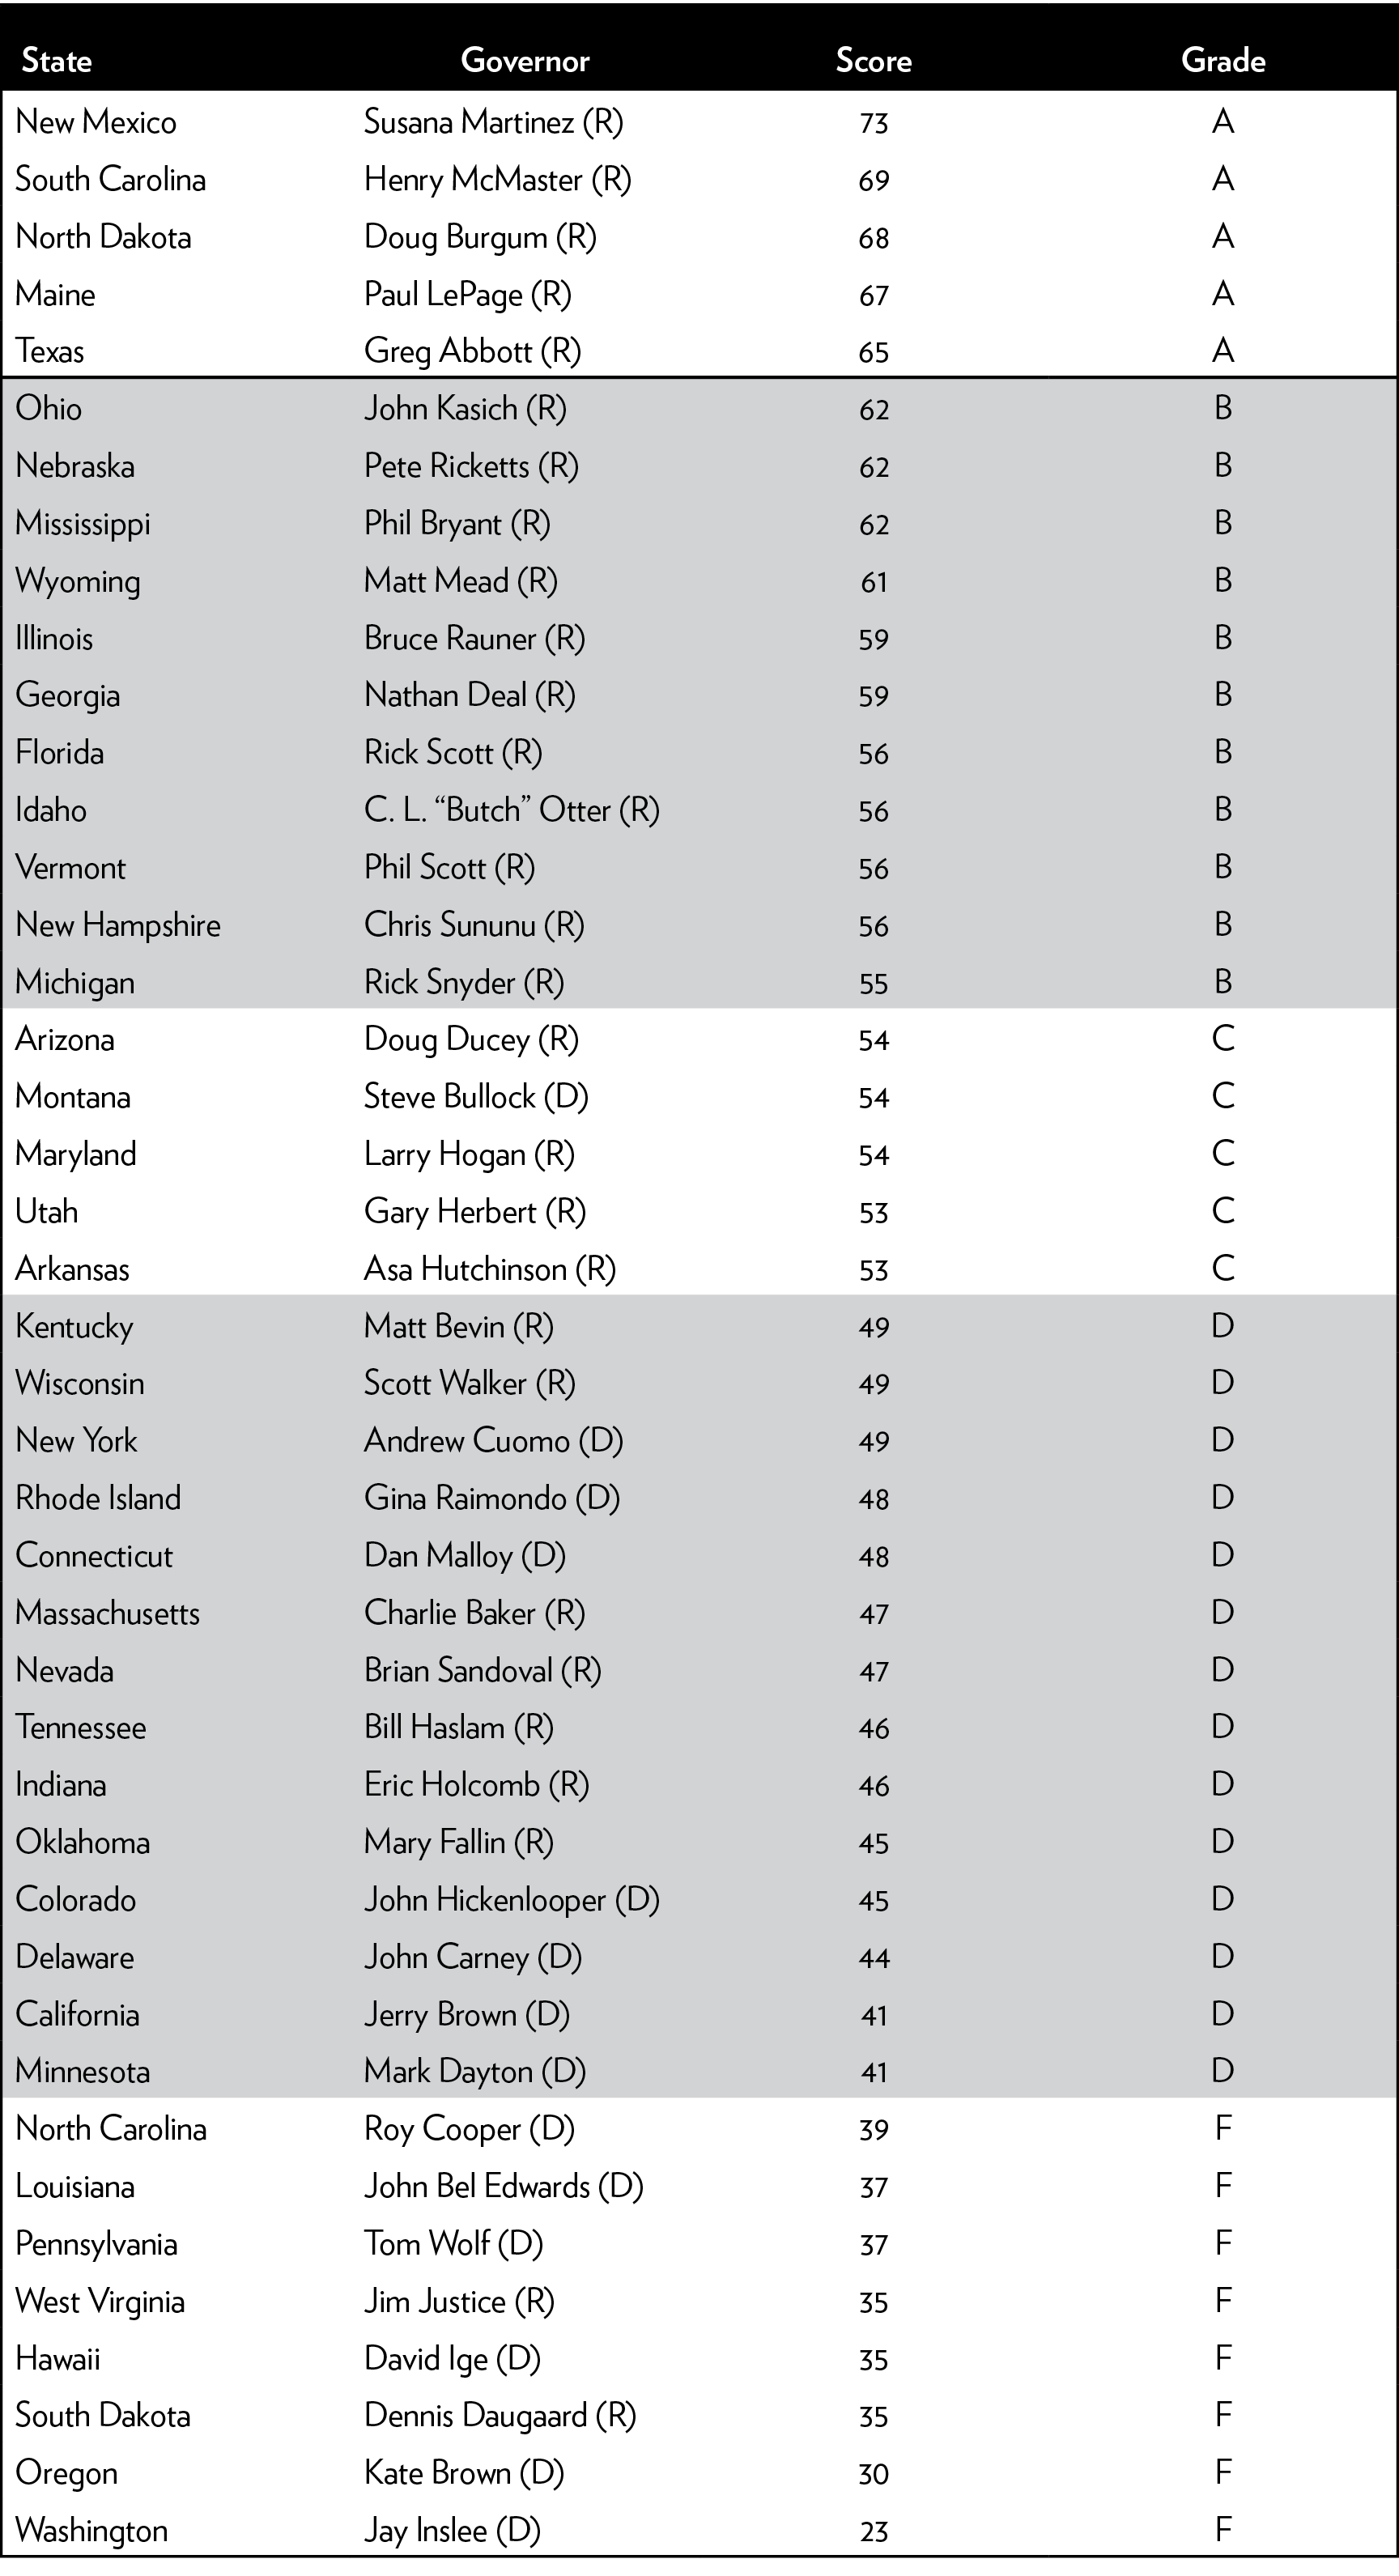
Table 1 presents the overall grades for the governors. Scores ranging from 0 to 100 were calculated for each governor based on seven tax and spending variables.
Scores closer to 100 indicate governors who favored smaller-government policies. The numerical scores were converted to the letter grades A to F.
Table 1: Overall grades for the governors
![]()
The following five governors received grades of A:
- Susana Martinez is in her eighth year as governor of New Mexico. She scored well on previous Cato reports, and she receives the highest score on this report. Martinez has a reputation for vetoing wasteful spending, and she has kept New Mexico’s general fund budget flat in recent years. On taxes, Martinez has pursued reforms to make New Mexico more competitive, including cutting the state’s corporate tax rate. In recent years, stagnant tax revenues from the oil industry have made balancing the state budget a challenge, but Martinez has held firm against tax increases proposed by the legislature. In 2017, she vetoed bills that would have increased taxes by $350 million a year.
- Henry McMaster of South Carolina is off to a fiscally conservative start as governor since 2017. He vetoed a bill that raised gas taxes and vehicle fees. And he proposed cutting individual income tax rates by 1 percentage point, which would reduce the top tax rate from 7 percent to 6 percent. If passed, the bill would provide more than $400 million in annual tax relief. On spending, McMaster proposed a restrained budget this year, and he is calling for an overhaul of the state’s public pension system to cut costs.
- Doug Burgum is a former technology entrepreneur who is in his first term as governor of North Dakota. He promised to restrain spending, run an efficient government, and not raise taxes, and he is fulfilling those promises so far. North Dakota’s energy boom turned to a bust a few years ago, and state revenues have fallen. Burgum has pursued spending cuts to balance the budget rather than tax increases. State spending was cut by 5 percent during the most recent budget cycle, and this year Burgum directed state agencies to cut their budgets by another 5 to 10 percent.
- Paul LePage of Maine has been a staunch fiscal conservative during his eight years in office. He has restrained spending, cut state government employment, reformed welfare programs, and cut taxes. He frequently speaks about the negative effects of big government programs. He has cut income tax rates and vetoed numerous tax hikes passed by the legislature. In 2017, LePage was able to repeal a 3 percentage point surtax on high earners under the income tax. In LePage’s most recent budget, he proposed cutting the corporate tax rate, repealing the estate tax, and replacing the multirate individual income tax with a 5.75 percent flat tax.
- Greg Abbott is a fiscal conservative who assumed the Texas governorship in 2015. The state general fund budget has been flat in recent years, and Abbott has pursued business tax cuts. In 2015, he approved a 25 percent cut to the state’s damaging franchise tax, which has saved Texas businesses $1.3 billion annually. In his 2017 state of the state address, Abbott proposed cutting the tax further, saying, “We must continue to cut the business franchise tax until it fits in a coffin.”2 Abbott has also approved legislation scrapping annual licensing fees on various professionals, saving Texans $125 million a year.
All the governors receiving a grade of A in this year’s report are Republicans, and six of the eight governors receiving an F are Democrats. There have been some high-scoring Democrats on past Cato report cards, but Republican governors tend to focus their agendas more on tax and spending cuts than do Democrats.
This Cato report has used the same grading method since 2008. In that year, Republican and Democratic governors had average scores of 55 and 46, respectively. In 2010, their average scores were 55 and 47; in 2012, 57 and 43; in 2014, 57 and 42; and in 2016, 54 and 43.
That pattern continues in the 2018 report. This time, Republican and Democratic governors had average scores of 55 and 41, respectively. Republicans received higher scores than Democrats, on average, on both spending and taxes, although the Republican advantage on taxes was greater than on spending.
When states develop budget gaps, Democratic governors often pursue tax increases to balance the budget, while Republicans focus on spending restraint. When the economy is growing and state coffers are filling up, Democrats tend to increase spending, while Republicans tend to both increase spending and pursue tax cuts.
Fiscal Policy Developments
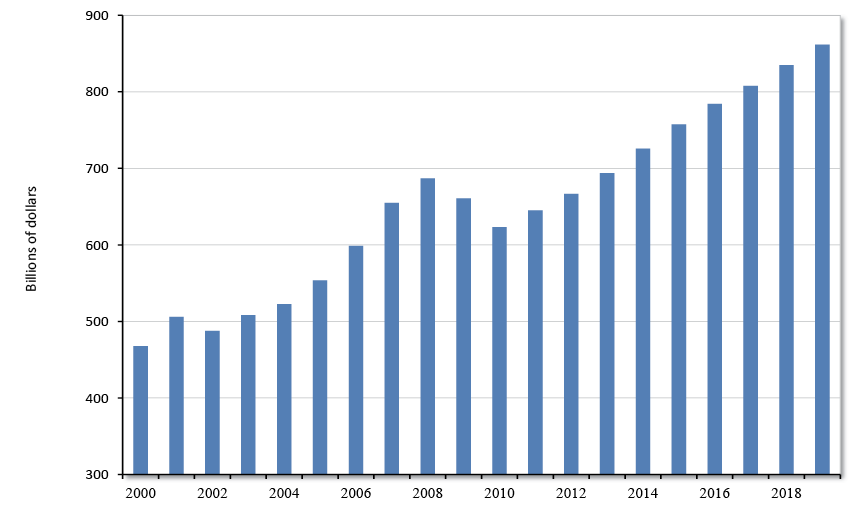
Figure 1 shows state general fund spending since 2000, based on data from the National Association of State Budget Officers.3
Spending soared between 2002 and 2008 and then fell during the recession as states cut their budgets. Since then, spending has bounced back strongly and has grown at an average annual rate of 3.7 percent since 2010.
Figure 1: State general fund spending
Education is the largest area of state spending. It accounts for 30 percent of total state budgets, with about two-thirds of the spending going toward K-12 schools and one-third going toward higher education.4 Over the most recent five years of data, state-funded K-12 spending grew at an average annual rate of 4.3 percent.5
The other key driver of state budgets is Medicaid, which is funded jointly by federal and state taxpayers. This giant program pays for the health care and long-term care of 75 million people.6 Medicaid accounts for 29 percent of total state spending. State-funded Medicaid spending grew by 6.0 percent in 2015, 4.1 percent in 2016, 7.8 percent in 2017, and about 7.3 percent in 2018.7
On the revenue side of budgets, states enacted overall net tax cuts in 2014 and 2015 but swung to net tax increases in 2016, 2017, and 2018.8
Cigarette and gasoline tax increases have been pursued by both Democratic and Republican governors. Since 2015, 16 states have enacted cigarette tax increases and 19 states have enacted gas tax increases.9
By contrast, income tax policy divides the parties, with many Democrats supporting increases and Republicans supporting decreases.
Federal Tax Base Conformity
The federal Tax Cuts and Jobs Act of 2017 cut individual and corporate income tax rates, but it also changed individual and corporate tax bases. Those base changes affected state tax systems because nearly every state with an income tax conforms to the federal income tax base to some extent.10
The states are about evenly split between those that automatically conform to federal tax changes (“rolling conformity”) and those that occasionally pass legislation to conform to the federal code that exists at a particular date (“fixed conformity”). There are also a few states that update their tax bases selectively, choosing to conform to only some parts of the federal tax code.
In most states, individuals start their state income tax calculations with federal adjusted gross income (AGI). In other states, individuals start with federal taxable income or a state-specific measure of income. Consider the expansion of standard deductions and the elimination of personal exemptions under the 2017 federal tax law.
Those changes altered state tax bases in those states that start with federal taxable income and in states that use federal definitions of deductions and exemptions.
Other federal tax changes altered state tax calculations for itemized deductions, child credits, small business capital expensing, and other items. The new federal deduction for pass-through businesses will affect the tax bases of states that conform to federal taxable income. Other states will have to decide whether to add this new deduction to their codes.
All in all, the 2017 federal tax reform generally broadened state tax bases and thus boosted state tax revenues. In recent months, governors and state legislatures have wrangled over how much of the increased state revenues to return to taxpayers.
South Carolina’s situation is representative of that faced by many states. A state report noted that if “the state doesn’t take action to account for the federal changes, South Carolina would receive a few million dollars more in income tax revenue but, by default, create a duplicative tax system that would likely be a nightmare to tax filers.
Meanwhile if legislators decide to conform to federal reform without making major changes to the state’s tax code, South Carolina could generate a whopping $200 million in extra revenue… . Yet another option would be for the state to conform to the federal code and make changes to the state’s tax code to offset the extra revenue.”11
As a fixed conformity state, if South Carolina does not respond to the federal change, taxpayers will deal with new tax rules that differ between their federal and state returns. A second option would be for South Carolina to pass legislation simply conforming to the federal law, but that would result in a large state tax increase. A third option would be to pass legislation conforming to federal law but also cutting state taxes. That approach is favored by South Carolina’s governor, Henry McMaster, but he and the legislature have not yet agreed on a plan to do so.12
Other states have pursued different paths. The best response has been from states that have conformed to the federal law but cut state income tax rates to hold taxpayers harmless, such as Idaho and Georgia. Idaho, for example, conformed to the federal tax law, which raised the state’s taxes by about $100 million a year, but Governor Butch Otter more than offset that increase by signing legislation that cut individual and corporate income tax rates and saved taxpayers about $200 million.13
Other states, such as Michigan and Nebraska, offset the tax-increasing effect of the 2017 federal tax law with state tax base adjustments rather than tax rate cuts. Still other states conformed to the federal law and pocketed the extra cash rather than giving it back to taxpayers. Colorado, for example, will pocket at least $200 million a year in extra state tax revenue and state policymakers plan to spend it.14
Supreme Court Ruling on Labor Unions
The government workforce is heavily unionized. In 2017, 36 percent of state and local government workers were members of labor unions, which was five times the private-sector share of 7 percent.15 About two-thirds of government education workers are members of unions.16
The union share in state and local government workforces varies widely, from less than 10 percent in North Carolina to about 70 percent in New York.17 Union shares are correlated with state rules regarding collective bargaining.
Three-quarters or more of the states have collective bargaining for at least some state and local workers. But North Carolina, Virginia, and some other states ban collective bargaining in the public sector.
Public-sector union shares are also correlated with “agency shop” rules. These rules require workers to either join their workplace union or pay the union an agency fee. In 2018, 23 states were agency-shop states, and 27 states were right-to-work states, where workers cannot be forced to join a union or pay union fees.18 Right-to-work states generally have lower union shares in their workforces.
Union rules for public employees changed in June 2018 when the U.S. Supreme Court decided Janus v. American Federation of State, County, and Municipal Employees (AFSCME). In that case, the court found that public employees cannot be forced to pay agency fees as a condition of their employment.
This ruling will weaken unions in state and local governments. The New York Timespredicted that public-sector unions “are going to get smaller and poorer in the coming years” and cited experts who expect membership to shrink by 10 to 30 percent. As the Times noted, “in the five years after Michigan passed a law ending mandatory union fees in 2012, the number of active members of the Michigan Education Association dropped by about 25 percent.”19
A drop in union membership would improve government finances because lawmakers would have more flexibility to restrain costs and improve state efficiencies. Unions tend to use their political power to push for higher wages and benefits. On average, public-sector unions increase compensation levels for their members by about 8 percent.20 When he was running for governor of Illinois in 2002, Rod Blagojevich apparently promised AFSCME large wage increases for their members if he was elected in return for their support on his campaign.21
Unions reduce government efficiency in other ways. Unions tend to protect poorly performing workers, they often push for larger staffing levels than are required, and they discourage the use of volunteers in government activities. They also tend to resist the introduction of new technologies and to create more rule-laden workplaces.
In Wisconsin, Governor Scott Walker signed into law public-sector union reforms in 2011. These reforms imposed restrictions on collective bargaining, including rules requiring that unions be recertified every year. Walker also signed legislation in 2015 making Wisconsin a right-to-work state. In response, the share of Wisconsin’s public-sector workers who belong to unions plunged from 50 percent in 2011 to 19 percent in 2017.22 With the Janus ruling, we may see similarly large drops in union membership in other states.
Supreme Court Ruling on Online Sales Taxes
Before a U.S. Supreme Court decision in 2018, businesses were generally not required to collect online sales taxes for a state unless they had a physical presence in that state. That approach limited online taxation and allowed e-commerce to boom over the past two decades.
Prior to the ruling, large businesses with physical property or employees in many states, such as Amazon, collected online sales taxes, but the physical presence rule shielded smaller businesses from the compliance burden of collecting all the different sales taxes across all the states that their customers lived in. There are more than 10,000 state and local jurisdictions in United States that impose sales taxes.
The 2018 Court decision, South Dakota v. Wayfair, overturned the physical presence rule and opened the door to broader online taxation.23
In the decision, the court identified features of South Dakota’s online tax approach that it viewed favorably. South Dakota’s law exempts small online retailers whose revenue from South Dakota falls below a certain threshold and who complete fewer than a certain number of transactions in the state.
And South Dakota has a single state-level administrator of sales taxes and fairly uniform sales tax bases and rates statewide. In response to the Supreme Court’s approval of South Dakota’s approach, many other states are modifying their online sales tax efforts to conform to it.
Some analysts fear, however, that the Wayfair decision will lead to a “wild west” of states aggressively expanding their taxation beyond their borders.24 In turn, that would advantage larger online businesses over smaller ones.25
Even when the physical presence standard held, many states stretched it with a patchwork of tax rules tied to computer cookies, airport stopovers, and other dubious measures of presence. The Wayfair decision may encourage states to adopt simpler approaches to taxing online commerce, but we will have to see.
The Wayfair decision has caused consternation among the five states that do not impose statewide retail sales taxes. New Hampshire Governor Chris Sununu issued a press release declaring that the state “will erect every possible and constitutionally permissible legal and procedural hurdle to prevent other states from forcing our businesses to collect sales and use taxes… . We will send a message to every out-of-state taxing jurisdiction and authority. If you try to come into our state and force our businesses to collect a sales tax in a manner that violates our laws or the United States Constitution, you will be in for the fight of your life.”26 Montana officials are also concerned about the Supreme Court decision.27 One Montana newspaper said that the ruling “will create a huge and expensive burden for small and medium-size Montana businesses that sell online but don’t have the capacity or financial ability to track and collect sales taxes.28
Online sales are still less than 10 percent of all retail sales, so there is no desperate need for states to grab more revenue in this manner.29 About half of all e-commerce is already taxed.
Uncollected e-commerce taxes are, at most, $13 billion nationally, which is only about 4 percent of total U.S. sales tax collections.30
Despite the rise of online sales, sales tax revenue has kept pace with the growth of the economy over the past three decades. General sales tax revenues as a percentage of gross domestic product have dipped only slightly, from 2.1 percent in 1990 to 2.0 percent today.31
States that expand their online sales tax efforts should minimize the compliance burden on businesses by simplifying their sales tax structures. They should also offset the added revenues collected with a reduction in sales or income tax rates.
Marijuana Taxes
Recreational marijuana is now legal in Alaska, California, Colorado, Maine, Massachusetts, Nevada, Oregon, Vermont, Washington State, and the District of Columbia. One incentive for states to legalize marijuana is to raise tax revenues.
All these jurisdictions except Alaska impose special retail sales taxes on marijuana, ranging from 10 percent in Nevada and Maine to 37 percent in Washington State.32 In addition, Alaska, California, Colorado, Maine, and Nevada impose taxes on growers. Vermont policymakers have not yet settled on tax rates.
In 2017, Colorado raised $247 million from marijuana taxes, Washington State raised $319 million, and Oregon raised $70 million.33 Cato’s Jeffrey Miron estimates that nationwide legalization could raise about $12 billion for federal, state, and local governments.34
However, we do not know the tax rates in states that may legalize pot in coming years, nor do we know the consumer responses to those taxes. If states set their tax rates too high, a substantial part of consumer demand will continue to be satisfied on the black market.
A recent empirical study found that the “medium-run elasticity of demand for marijuana is higher than the consensus estimates for cigarettes or gasoline.”35 Thus, policymakers should take care to keep marijuana tax rates low.
Legalizing recreational marijuana will be on the ballot this November in Michigan, and governors and legislators in many other states are considering legalization. North of the border, recreational marijuana will be legal nationwide in Canada starting in October 2018.
Interstate Migration
The 2017 federal tax reform law was the largest overhaul of the federal income tax in decades. The law changed deductions, exemptions, and tax rates for individuals while also changing the tax base and rates for businesses.
One key reform was the capping of the federal deduction for state and local taxes (SALT) at $10,000. That cap, along with the doubling of the standard deduction, will reduce the number of households deducting state and local income, sales, and property taxes from 42 million in 2017 to 17 million in 2018.36 For taxpayers who continue to take the deduction, the average benefit will be much smaller.
Before this change in the law, federal deductibility effectively subsidized high-tax states and encouraged them to load taxes onto high earners. It also encouraged government expansion. As the Congressional Budget Office noted of the SALT deduction, “Because of the subsidy, too many [government] services may be supplied, and state and local governments may be bigger as a result.”37
With the capping of the deduction, millions of households will feel a larger bite from state and local taxes, and thus become more sensitive to tax differences between the states.
The tax law may increase the outflow of mainly higher-income households from high-tax states to low-tax states. The states where SALT deductions were the largest relative to incomes were high-tax states such as New York, New Jersey, and California.38
If high earners move out of high-tax states in substantial numbers, it would be a blow to state revenues. In New York, the top 1 percent of earners pay 41 percent of state income taxes, and in New Jersey the share is 37 percent.39 In California, the top 1 percent pay a remarkable 50 percent of state income taxes.40
The Internal Revenue Service (IRS) publishes data showing the interstate movements of tax-filing households.41 The data show that 2.8 percent of households moved between states in 2016. There are an average 2.1 people per household in the IRS data.42
Some states gain residents from interstate migration, and some states lose them. The largest loser from interstate migration is New York. In 2016, it lost 218,937 households to other states and gained 142,722 households from other states, for a net loss of 76,215.
The other states with the largest net migration losses were Illinois (41,965 households); New Jersey (25,941); California (25,913); Pennsylvania (19,516); Massachusetts (14,549); Ohio (13,254); Connecticut (12,254); Maryland (12,068); and Michigan (10,325).
Where did those domestic migrants go?
The largest net inflows were to Florida (95,072 households); Washington State (30,480); North Carolina (25,601); Colorado (24,672); Arizona (24,211); Oregon (21,729); Texas (19,414); South Carolina (18,519); Georgia (17,798); and Nevada (14,236). These 2016 migration flows generally reflect extended trends. New York has been losing residents to other states for decades, while Florida has been gaining residents for decades.
Each state’s attractiveness can be measured by the ratio of gross inflows to gross outflows. States losing population have ratios less than 1.0, whereas states gaining population have ratios greater than 1.0. New York’s ratio was 0.65 in 2016, meaning that for every 100 households that left the state, only 65 households moved in. Florida’s ratio was 1.45, meaning that 145 households moved in for every 100 that left.
Even before the new federal tax law, Americans tended to move from higher-tax states to lower-tax states. Looking at the 2016 migration flows, 286,431 households (consisting of 578,269 people) moved, on net, from the 25 highest-tax states and the District of Columbia to the 25 lowest-tax states in that single year. Taxes are measured as state and local sales, property, and individual income taxes as a percentage of personal income.43
Figure 2 plots state migration ratios on the vertical axis and state tax ratios on the horizontal axis. The figure shows a clear negative relationship between migration ratios and tax levels. On the left, states have lower taxes and net in-migration (a ratio greater than 1.0). On the right, states have higher taxes and net out-migration (a ratio less than 1.0).
Figure 2: Tax levels and net migration ratios, 2016
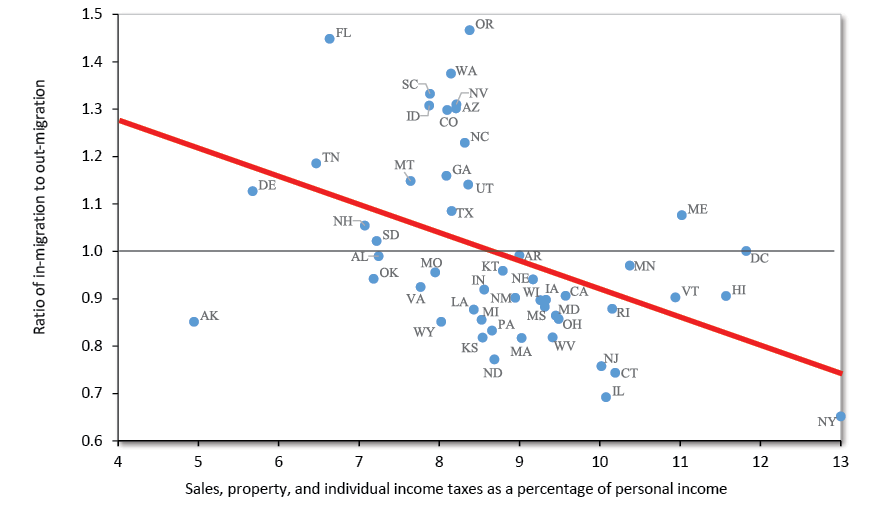
Of the 25 highest-tax states, 24 had net out-migration. Of the 25 lowest-tax states, 17 had net in-migration. The figure includes a fitted regression line that shows the correlation between interstate migration and tax levels.44
Interstate migration is influenced by many factors other than taxes, including job opportunities, housing costs, and climate.
Experts disagree on how large a role taxes play in migration, but that role will certainly increase under the 2017 federal tax law. A recent Cato Institute study explored these relationships in more detail.45
The new federal tax law has ushered in an era of increased interstate tax competition. Governors should rethink their tax codes with an eye to retaining and attracting residents and businesses.
They should consider how to reduce tax rates and improve the efficiency of their state’s public services to give their taxpayers more value for their money.
Appendix A
Report Card Methodology
This study computes a fiscal policy grade for each governor based on his or her success at restraining taxes and spending since 2016, or since 2017 for governors who entered office in that year.
The spending data used in this study come from the National Association of State Budget Officers (NASBO) and, in some cases, from the budget documents of individual states.
The data on proposed and enacted tax cuts come from NASBO, the National Conference of State Legislatures, news articles in State Tax Notes, and many other sources.46 Tax-rate data come from the Tax Foundation and other sources.
This year’s report uses the same methodology as the 2008, 2010, 2012, 2014, and 2016 Cato fiscal policy reports. The report focuses on short-term taxing and spending actions to judge whether the governors take a small-government or a big-government approach to fiscal policy.
Each governor’s performance is measured using seven variables: two for spending, one for revenue, and four for tax rates. Their overall score is calculated as the average of their scores in these three categories. Tables A.1 and A.2 summarize the governors’ scores.
Table A.1: Spending and revenue changes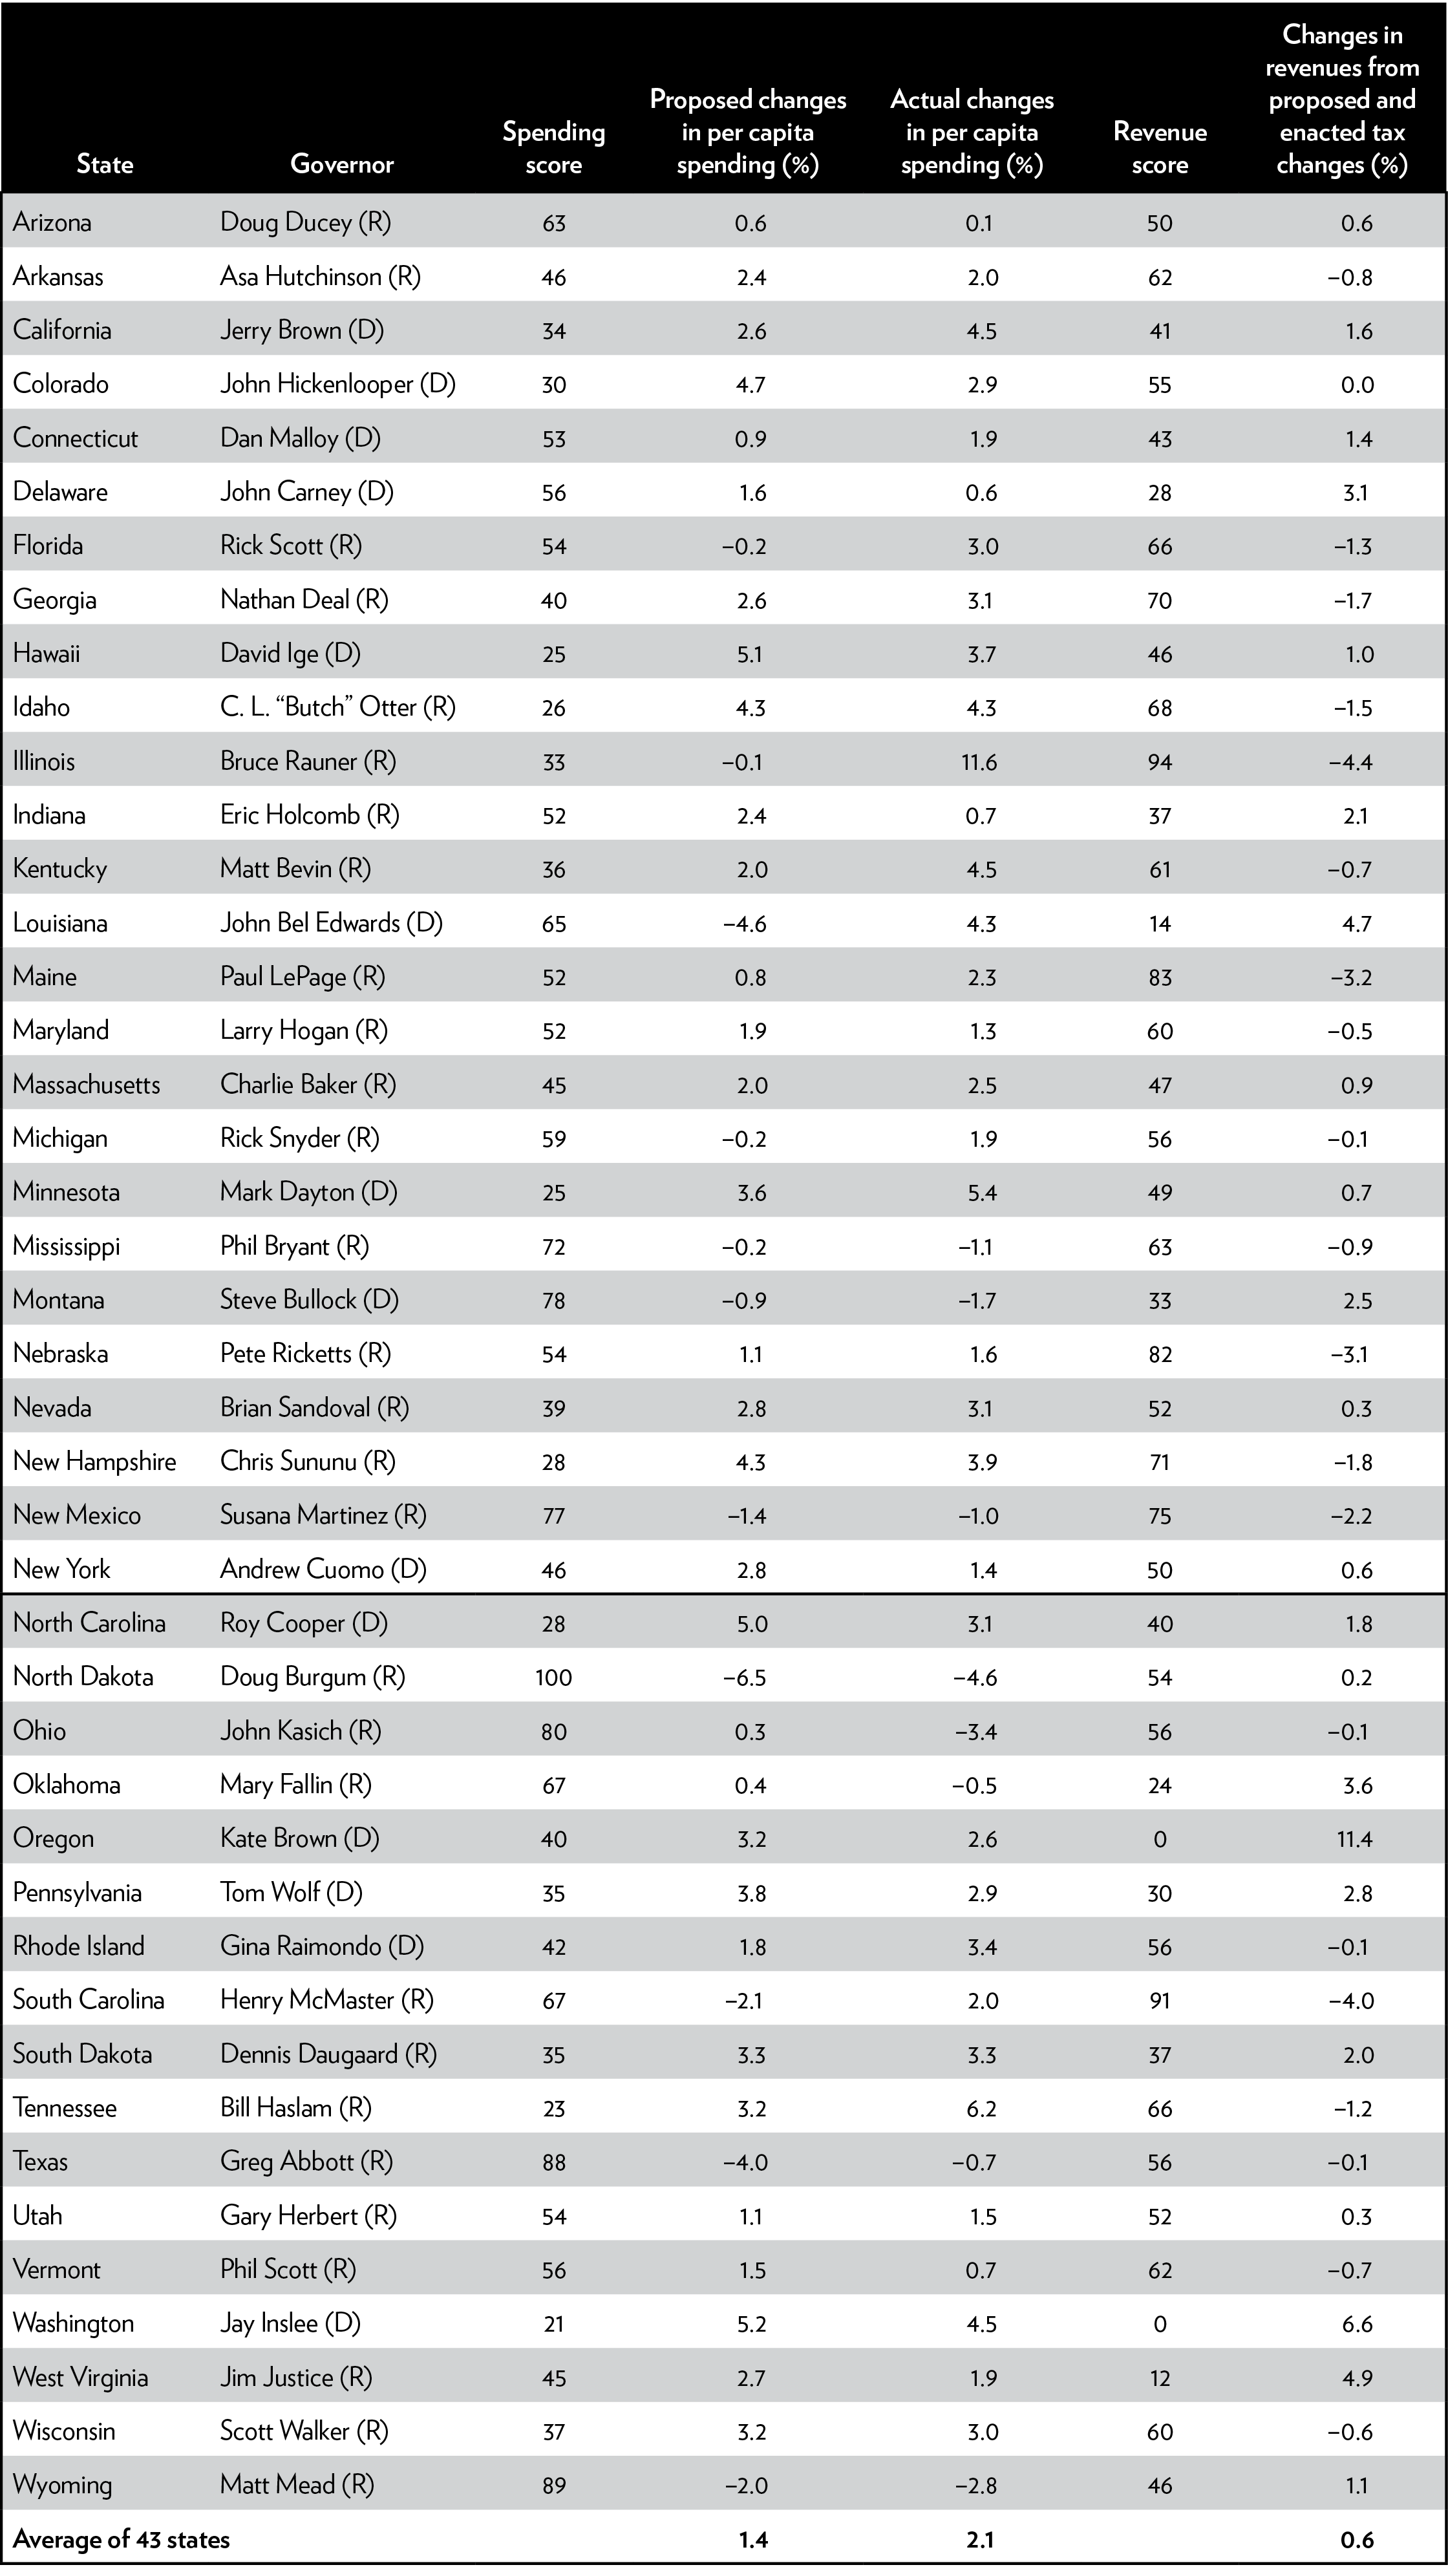
Spending Variables
- Average annual percent change in per capita general fund spending proposed by the governor
- Average annual percent change in actual per capita general fund spending.
Revenue Variable
- Average annual dollar value of proposed, enacted, and vetoed tax changes. This variable is measured by the reported estimates of the annual dollar effects of tax changes as a percentage of a state’s total tax revenues. This is an important variable, and it is compiled from many news articles, budget documents, and reports.47
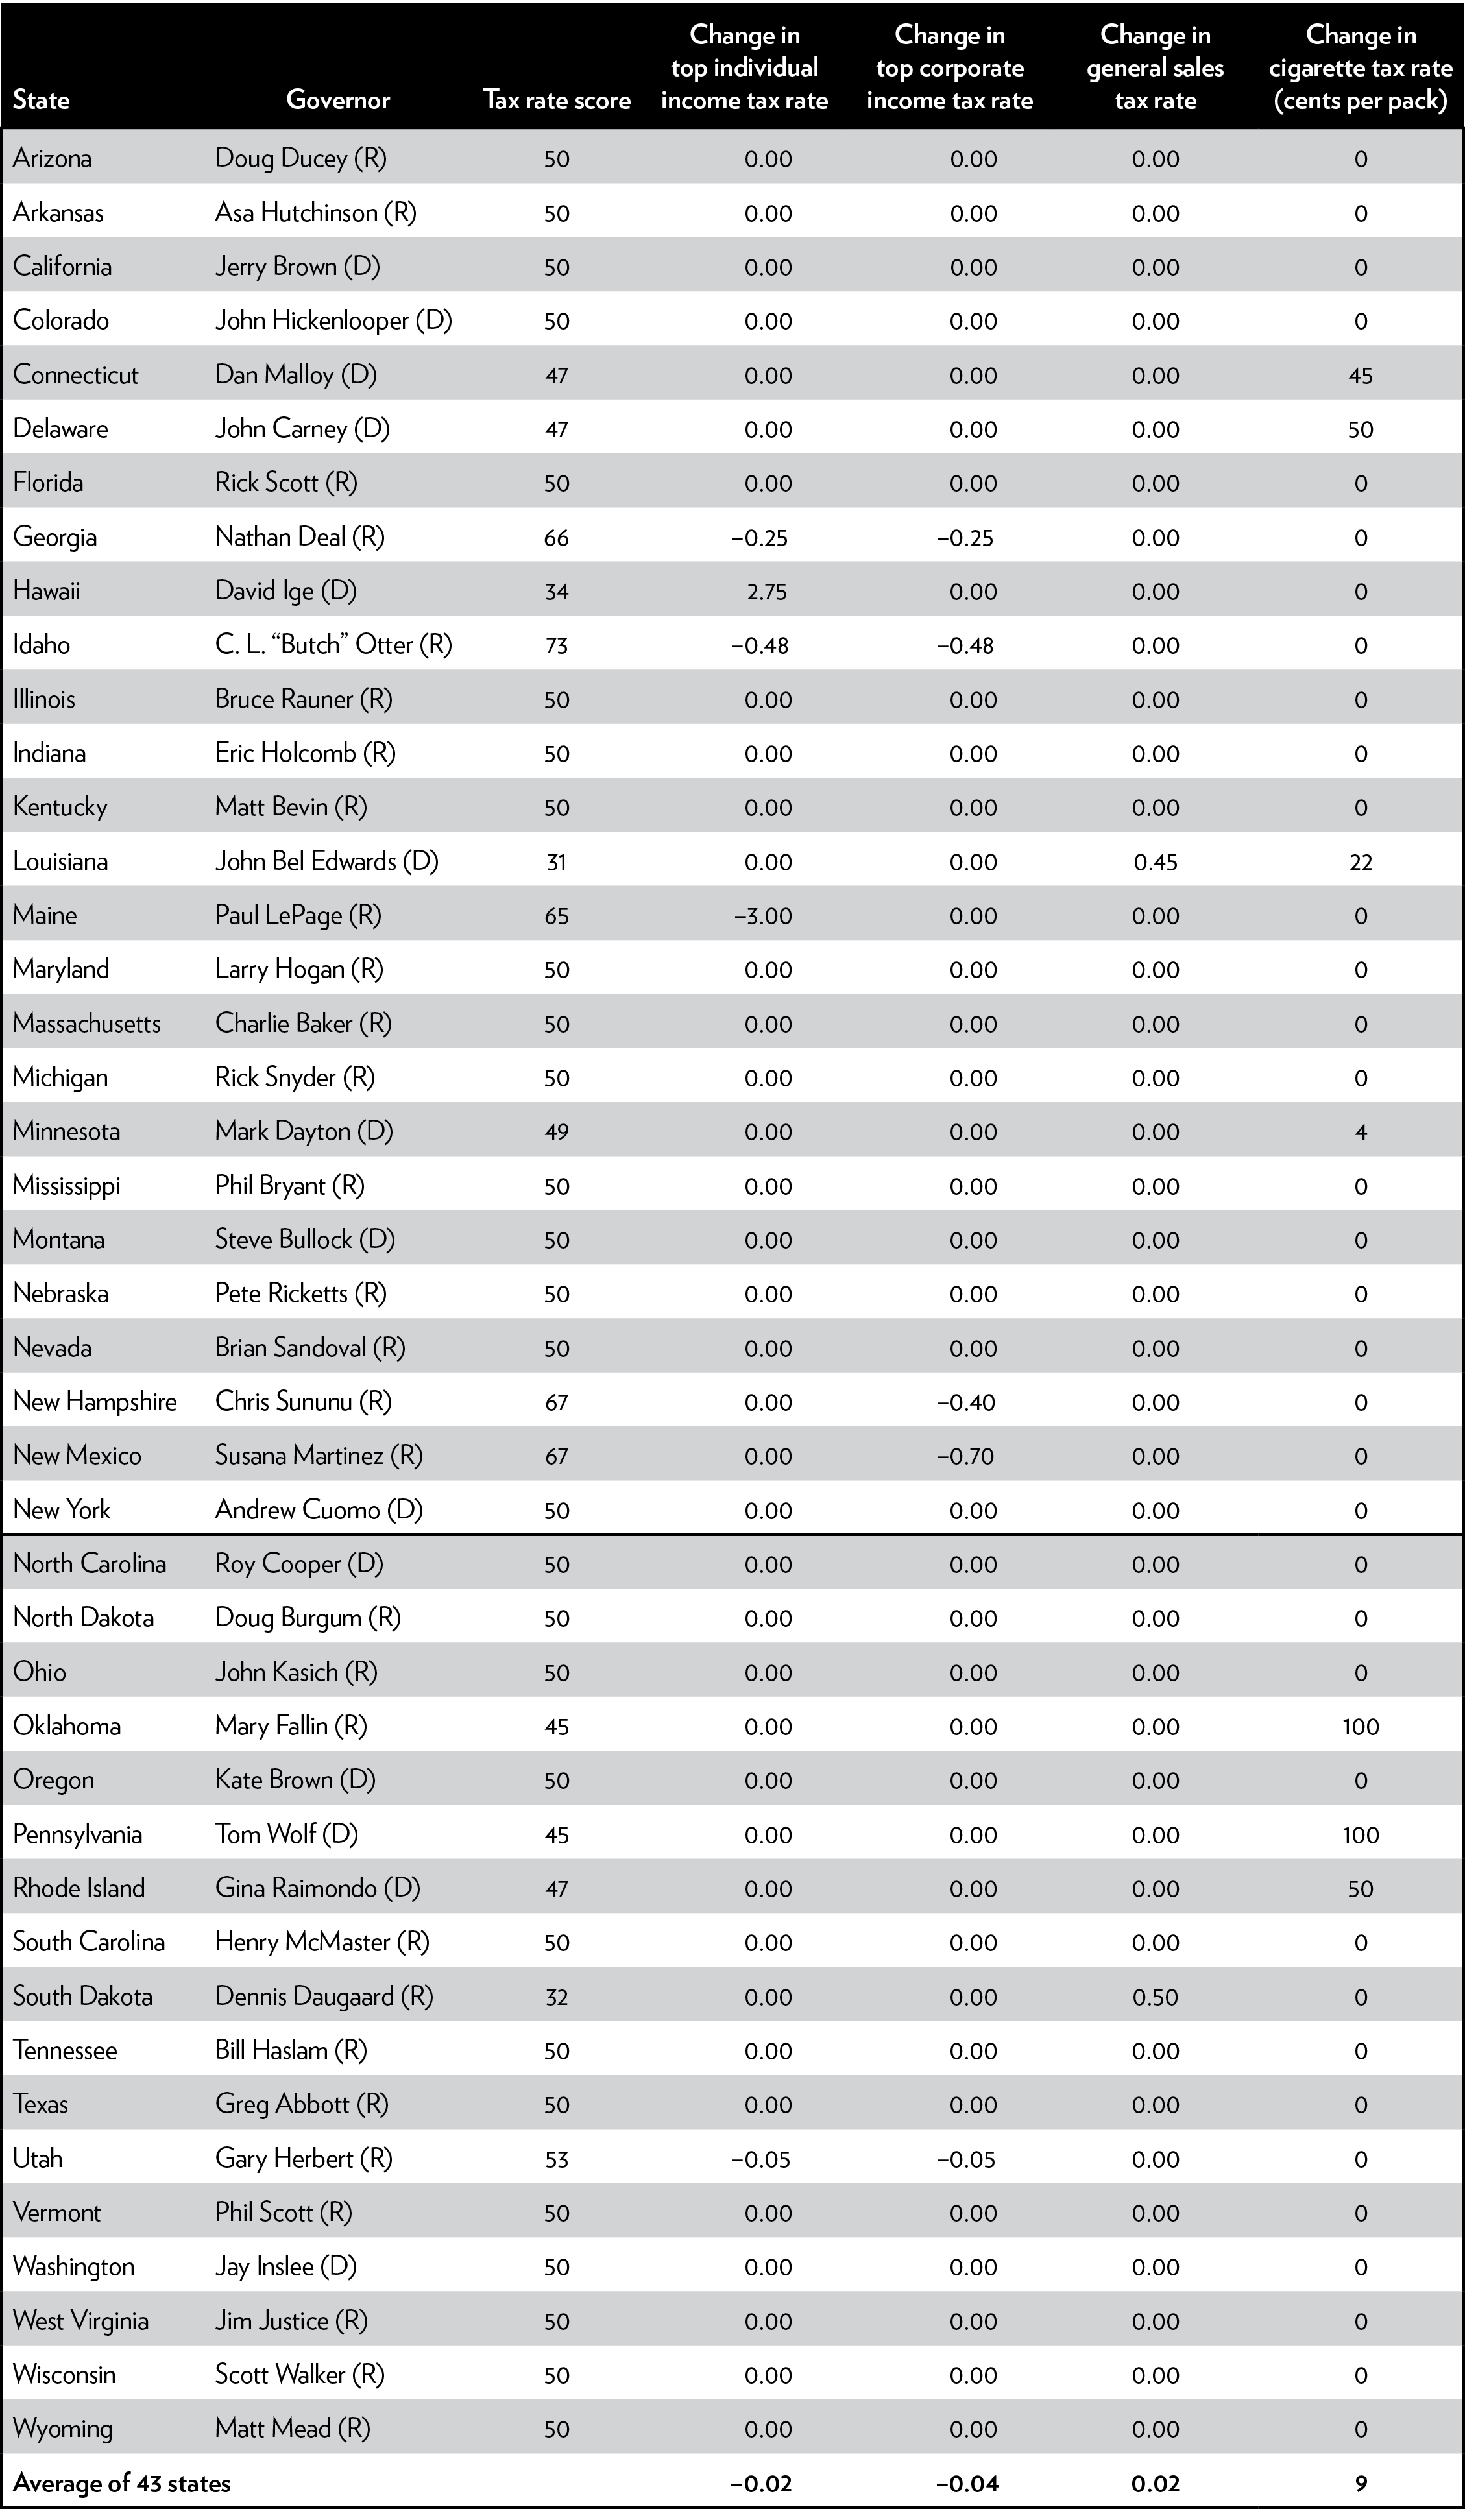
Tax Rate Variables
- Change in the top personal income tax rate approved by the governor
- Change in the top corporate income tax rate approved by the governor
- Change in the general sales tax rate approved by the governor
- Change in the cigarette tax rate approved by the governor.
The two spending variables are measured on a per capita basis to adjust for state populations that are growing at different rates. Also, the spending variables measure only the changes in general fund budgets, which are the budgets that governors have the most control over.
Variable 1 is measured through fiscal 2019, and variable 2 is measured through fiscal 2018. Variables 3 through 7 cover changes from January 2016 to August 2018, or from January 2017 to August 2018, for governors who entered office in 2017.
For each variable, the results are standardized so that the worst scores fall near zero and the best scores fall near 100. The scores for each of the three categories — spending, revenue, and tax rates — are calculated as the average score of the variables within the category, with one exception: the cigarette tax rate variable is quarter-weighted because that tax is a smaller source of state revenue than the other taxes measured in its category.
The average of the scores for the three categories produces the overall grade for each governor.
Measurement Caveats
This report uses publicly available data to measure the fiscal performance of the state governors. There are, however, some unavoidable problems in such grading. For one, this report card cannot fully isolate the policy effects of the governors from the fiscal decisions of their states’ legislatures.
Governors and legislatures both influence tax and spending outcomes, and if a legislature is controlled by a different party, a governor’s control may be diminished. To help isolate the performance of governors, variables 1 and 3 measure the effects of each governor’s proposed, although not necessarily enacted, policies.
Another factor to consider is that the states grant governors differing amounts of authority over budget processes. For example, most governors are empowered with a line-item veto to trim spending, but some governors do not have that power.
Another example is that the supermajority voting requirement to override a veto varies among the states. Such factors give governors different levels of budget control that are not accounted for in this study.
Nonetheless, the results presented here should be a good reflection of each governor’s fiscal approach. Governors who received a grade of A have focused on reducing tax burdens and restraining spending.
Governors who received a grade of F have pursued government expansion. In the middle are many governors who gyrate between different fiscal approaches from one year to the next.
Appendix B
Fiscal Policy Notes on the Governors
Below are highlights of the fiscal records of the 43 governors covered in this report. The discussions are based on the tax and spending data used to grade the governors as well as on other information that sheds light on each governor’s fiscal approach.48
Note that the grades are calculated based on each governor’s record since 2016, or since 2017 if that year was the governor’s first in office.
[divide width=”medium” color=”#291c1c”]The Cato Institute is a public policy research organization — a think tank — dedicated to the principles of individual liberty, limited government, free markets, and peace. Its scholars and analysts conduct independent, nonpartisan research on a wide range of policy issues.
To view the Cato Institute’s full report breakdown visit, https://www.cato.org/publications/white-paper/fiscal-policy-report-card-americas-governors-2018.
Notes
1 For governors elected in the fall of 2016, the data cover the period January 2017 to August 2018.
2 Office of the Texas Governor, “Governor Abbott Delivers State of the State Address,” January 31, 2017.
3 National Association of State Budget Officers, “The Fiscal Survey of States,” Spring 2018. These are fiscal years. The figure for 2019 is the recommended increase.
4 National Association of State Budget Officers, “State Expenditure Report, 2015-2017,” 2017.
5 National Association of State Budget Officers, “State Expenditure Report,” various issues.
6 National Association of State Budget Officers, “The Fiscal Survey of States,” Spring 2018, p. 73.
7 National Association of State Budget Officers, “The Fiscal Survey of States,” Spring 2018, p. 76. See also National Association of State Budget Officers, “State Expenditure Report, 2015-2017,” 2017, p. 48. These are fiscal years.
8 National Association of State Budget Officers, “The Fiscal Survey of States,” Spring 2018, p. 54. These are fiscal years.
9 For cigarette taxes, see Campaign for Tobacco-Free Kids, “Cigarette Tax Increases by State per Year 2000-2018,” July 1, 2018, https://www.tobaccofreekids.org/assets/factsheets/0275.pdf. For gasoline taxes, see National Conference of State Legislatures, “Recent Legislative Actions Likely to Change Gas Taxes,” February 20, 2018.
10 Jared Walczak, “Tax Reform Moves to the States: State Revenue Implications and Reform Opportunities Following Federal Tax Reform,” Tax Foundation, January 31, 2018. See also Richard C. Auxier and Frank Sammartino, “The Tax Debate Moves to the States: The Tax Cuts and Jobs Act Creates Many Questions for States That Link to Federal Income Tax Rules,” Urban Institute, January 22, 2018.
11 South Carolina Statehouse Report, “5/25: Impact of Tax Conformity; Southern Accents; Henry McMaster; Phil Noble,” July 31, 2018, http://www.statehousereport.com/2018/05/25/5-25-impact-of-tax-conformity-southern-accents-henry-mcmaster-phil-noble/.
12 Dylan Grundman, “An Update on State Responses to the Federal Tax Bill,” Institute on Taxation and Economic Policy, July 3, 2018, https://itep.org/an-update-on-state-responses-to-the-federal-tax-bill/.
13 Betsy Z. Russell, “Otter Signs HB 463, the Big Income Tax Cut Bill, into Law,” The Spokesman-Review (Spokane, WA), March 12, 2018.
14 Brian Eason, “Why the Newly Passed Federal Tax Cut Will Mean Higher State Taxes for Some in Colorado,” Denver Post, December 20, 2017.
15 Bureau of Labor Statistics, “Union Members 2017,” news release, January 19, 2018, https://www.bls.gov/news.release/archives/union2_01192018.pdf.
16 Henry S. Farber, “Union Membership in the United States: The Divergence between the Public and Private Sectors,” Working Paper no. 503, Industrial Relations Section, Princeton University, September 2005, http://harris.princeton.edu/pubs/pdfs/503.pdf.
17 Chris Edwards, “Public-Sector Unions,” Cato Institute Tax and Budget Bulletin no. 61, March 17, 2010. See also http://www.unionstats.com.
18 National Right to Work Legal Defense Foundation, “Right to Work States.”
19 Noam Scheiber, “Labor Unions Will Be Smaller after Supreme Court Decision, but Maybe Not Weaker,” New York Times, June 27, 2018.
20 Chris Edwards, “Public-Sector Unions and the Rising Costs of Employee Compensation,” Cato Journal 30, no. 1 (Winter 2010): 87-115.
21 James Taranto, “Bruce Rauner vs. the Illinois Mafia,” opinion, Wall Street Journal, March 3, 2018.
22 Barry T. Hirsch and David A. Macpherson, “Union Membership and Coverage Database from the CPS,” http://www.unionstats.com.
23 Joseph Bishop-Henchman, “Supreme Court Decides Wayfair Online Sales Tax Case,” Tax Foundation, June 21, 2018, https://taxfoundation.org/supreme-court-decides-wayfair-online-sales-tax-case/. See also Joseph Bishop-Henchman, “What Does the Wayfair Decision Really Mean for States, Businesses, and Consumers?,” Tax Foundation, July 9, 2018, https://taxfoundation.org/what-does-the-wayfair-decision-really-mean-for-states-businesses-and-consumers/.
24 Adam Michel, “Supreme Court Botches Wayfair Ruling, Putting Small Online Businesses at Risk of New Taxes,” Daily Signal, June 21, 2018, https://www.dailysignal.com/2018/06/21/supreme-court-botches-wayfair-ruling-putting-small-online-businesses-at-risk-of-new-taxes/.
25 Zoë Henry, “A Supreme Court Ruling on Internet Sales Tax Is ‘Absolutely Hair Raising’ for Small Businesses,” Inc.com, July 16, 2018, https://www.inc.com/zoe-henry/supreme-court-wayfair-south-dakota-internet-sales-tax.html.
26 Office of Governor Chris Sununu, “Governor Sununu and State Leaders Unveil Strategy to Fight Supreme Court Sales Tax Case,” June 28, 2018.
27 Phil Drake, “Sales Tax Ruling Doesn’t Make Cents for Montana, Officials Say,” Great Falls Tribune (Great Falls, MT), June 21, 2018.
28 Holly K. Michels, “Montana Officials: Court Decision on Online Sales Tax Will Hurt Small Businesses,” Helena Independent Record (Helena, MT), June 21, 2018.
29 U.S. Census Bureau, “Quarterly Retail E-Commerce Sales: 2nd Quarter 2018,” August 17, 2018, https://www.census.gov/retail/mrts/www/data/pdf/ec_current.pdf.
30 Government Accountability Office, “States Could Gain Revenue from Expanded Authority, but Businesses Are Likely to Experience Compliance Costs,” GAO-18-114, December 18, 2017, https://www.gao.gov/products/GAO-18-114.
31 Bureau of Economic Analysis, National Income and Product Accounts, Tables 1.1.5 and 3.3.
32 Katherine Loughead and Morgan Scarboro, “How High Are Recreational Marijuana Taxes in Your State?” Tax Foundation, April 26, 2018, https://taxfoundation.org/state-marijuana-taxes-2018/.
33 Miron, “The Budgetary Effects of Ending Drug Prohibition.”
34 Jeffrey Miron, “The Budgetary Effects of Ending Drug Prohibition,” Cato Institute Tax and Budget Bulletin no. 83, July 2018. See also New Frontier Data, “Cannabis Taxes Could Generate $106 Billion, Create 1 Million Jobs by 2025,” news release, March 13, 2018, https://newfrontierdata.com/marijuana-insights/cannabis-taxes-generate-106-billion-create-1-million-jobs-2025/.
35 Benjamin Hansen, Keaton Miller, and Caroline Weber, “The Taxation of Recreational Marijuana: Evidence from Washington State,” National Bureau of Economic Research Working Paper no. 23632, July 2017.
36 Joint Committee on Taxation, “Tables Related to the Federal Tax System as in Effect 2017 through 2026,” JCX-32R-18, April 24, 2018, Table 7, https://www.novoco.com/sites/default/files/atoms/files/x-32-18.pdf.
37 Congressional Budget Office, “The Deductibility of State and Local Taxes,” February 20, 2008, https://www.cbo.gov/publication/41647.
38 Jared Walczak, “The State and Local Tax Deduction: A Primer,” Tax Foundation, March 15, 2017, https://taxfoundation.org/state-and-local-tax-deduction-primer/.
39 State of New Jersey, Department of Treasury, “Statistics of Income,” January 12, 2018, Tables B and 3.1b. See also New York State, Department of Taxation and Finance, “Analysis of 2014 Personal Income Tax Returns,” Table 21. New York data are for 2014; New Jersey data are for 2015.
40 Justin Garosi and Jason Sisney, “Top 1 Percent Pays Half of State Income Taxes,” California Legislative Analyst’s Office, December 4, 2014.
41 IRS migration data are available at SOI Tax Stats-Migration Data, www.irs.gov/statistics/soi-tax-stats-migration-data.
42 The IRS data include the number of tax exemptions per household, which measures the number of people in each household or tax filing unit.
43 For details, see Chris Edwards, “Tax Reform and Interstate Migration,” Cato Institute Tax and Budget Bulletin no. 84, September 2018.
44 A simple regression of the migration ratio on the tax variable produces a highly statistically significant fit. The F statistic (12.1) and t statistic (3.5) are significant at the 99-percent level.
45 Edwards, “Tax Reform and Interstate Migration.”
46 For data on enacted state tax changes, see National Conference of State Legislatures, “State Tax Actions 2016,” 2017 and National Conference of State Legislatures, “State Tax Actions 2017,” 2018. Note that State Tax Notes is published by Tax Analysts, Falls Church, Virginia.
47 The National Association of State Budget Officers compiles tax changes proposed by governors, and the National Conference of State Legislatures compiles enacted tax changes. However, these data sources have substantial shortcomings, so I examined hundreds of news articles and state budget documents to assess the major tax changes during each governor’s tenure. Tax changes seriously proposed by governors, tax changes vetoed by them, and tax changes signed into law were all taken into account. It is, however, difficult to measure this variable in an entirely precise manner. Legislation creating temporary tax changes was valued one-quarter as highly as legislation creating permanent tax changes.
48 For simplicity, all of the changes in general fund spending mentioned in this report are overall increases in spending, but the report card was scored on the basis of per capita change in spending. Also note that all spending data refer to state fiscal years rather than to calendar years.


