August Housing Insights: Austin Led The State In Most All State Housing Growth
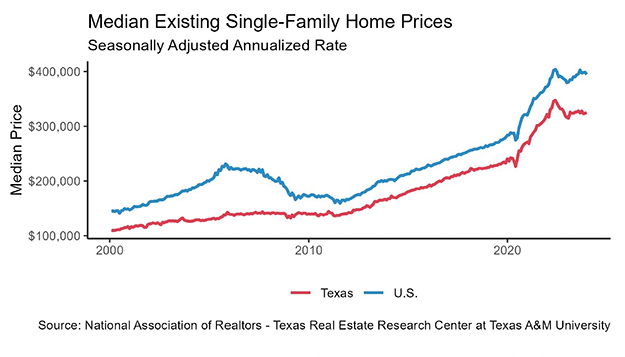
The median price for existing homes in Austin ($293,097), Dallas ($269,986), and Fort Worth ($211,907) also reached all-time highs amid shortages for homes under $300,000.
by James P. Gaines, Luis B. Torres, Wesley Miller, and Bailey Cuadra (Oct 2, 2017)
The impact of Hurricane Harvey and the subsequent flooding is not fully captured in the August data. The short and long-run effects of the disaster and recovery process are considered and may result in some data revisions in future reports.
The Texas housing market staggered as Harvey shut down the Houston economy for almost a week. The drastic 26.7 percent year-over-year (YOY) decline in Houston housing sales reflects the magnitude of the market disruptions. On the supply side, a 21.2 percent YOY decrease in Houston housing permits pulled Texas out of the top ten states for monthly permits per capita. In the rest of Texas, market fundamentals were relatively unchanged, with supply constraints persisting in the resale market resulting in elevated price pressures and some slowdown in sales activity.
Supply*
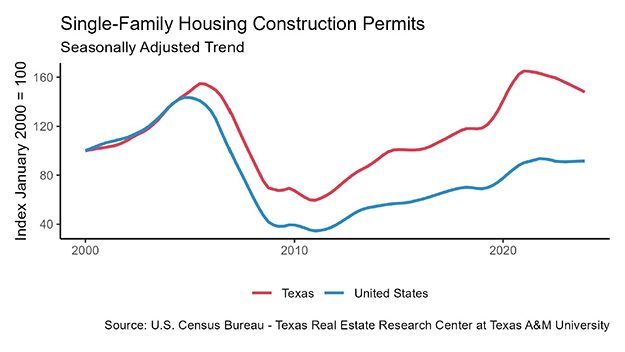
The Texas Residential Construction Cycle (Coincident) Index, which measures current construction activity, decelerated due to slowing multifamily construction values. The Texas Residential Construction Leading Index (RCLI) fell as real interest rates have risen from last year, signaling a future downturn in the residential construction business cycle.
Statewide, single-family housing construction permits dropped 2.9 percent relative to last August, marking the first YOY decline in ten months. The impact of Hurricane Harvey shocked the Houston market as permits sunk 21.2 percent relative to last year. Aside from Houston, the Texas Urban Triangle posted strong permit growth, sustaining Texas’ position as the national leader in total permits issued. However, Texas fell out of the top ten when ranked by permits per capita. Dallas surpassed Houston as the national leader, issuing 3,171 and 2,525 non-seasonally adjusted permits, respectively, marking the first time since September 2008 that Houston did not top the nation. Permits trended upward in Fort Worth and San Antonio, increasing 27.0 and 22.1 percent YOY. In Austin, permits stabilized but remained negative year to date (YTD).
Total Texas housing starts fell 1.0 percent YOY led by declines in multifamily construction. Starts could sink lower if Houston construction delays persist into September before the recovery effort stimulus. Single-family private construction values, which closely track housing starts, dropped 0.9 percent in Texas on a three-month moving average (3MMA) amid a 5.6 percent decline in Houston. Construction values also contracted in Dallas, falling for the fourth consecutive month. The trend was positive in Austin and San Antonio where values increased 1.7 and 1.0 percent on a 3MMA, respectively.

The Texas months of inventory (MOI) held steady at 3.8 months; around six months is considered a balanced housing market. The MOI remained especially constricted for homes under $200,000, equaling just below 3.1 months for the fifth straight month. Inventories for homes priced between $200,000-$300,000 inched forward, approaching 3.3 MOI after bottoming out in February at 3.0 months.
Tight inventories were prevalent in the existing home market, where homes are generally less expensive than newly constructed equivalents. Similar to the bottom price cohort, the Texas MOI for existing homes remained unchanged since April at 3.5 months. Fort Worth, Dallas, and Austin maintained exceptionally low inventories at 2.0, 2.1, and 2.1 months, respectively. In San Antonio, the MOI increased every month since March, settling at 3.2 months. Houston held the largest supply of listings at 3.7 months but is subject to a post-hurricane shock in upcoming months. Recent estimates suggest, Hurricane Harvey and the subsequent flooding damaged an estimated 159,198 homes in the Houston MSA, presenting increased supply challenges to the housing market.
The number of new listings in Texas was stable as the new home MOI settled at 5.4 months, the highest since 2011. Houston posted 3.2 percent growth, surpassing the state average, as it climbed to 5.5 months. The MOI extended past five months in Austin and San Antonio and trended upward in Dallas and Fort Worth at 4.7 and 4.4 months, respectively. Supply conditions continued to normalize for new homes but have not offset the resale market imbalances.
Demand
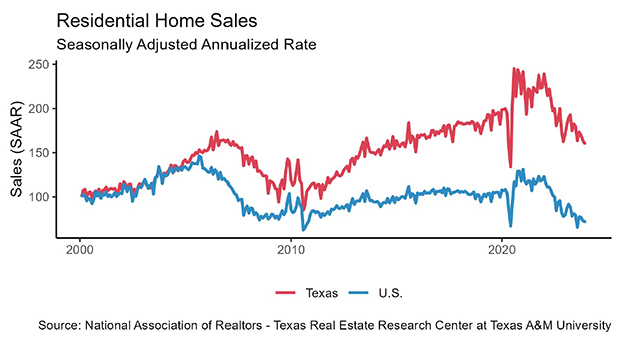
Texas housing sales declined 5.9 percent YOY led by a 26.7 percent YOY decline in Houston after Hurricane Harvey. The remaining major metros posted positive sales growth after stumbling in July. The number of Dallas homes sold through the Multiple Listing Service (MLS) surpassed Houston for the first time since 2008, rising 5.0 percent. Austin led the Urban Triangle in YOY growth at 3.1 percent, while Fort Worth and San Antonio trended upward at 1.2 and 1.4 percent, respectively.
Sales of homes priced under $200,000 contracted for the third consecutive month, accounting for over 85 percent of the statewide decline. Sales growth in the top price cohort (homes priced above $500,000) decelerated substantially: YOY growth fell from 22.4 percent in July to 0.1 percent this month. The middle price cohorts, which represent over 50 percent of the Texas market, posted positive sales growth after sliding in June and July.
Texas housing demand remained robust as the average days on market (DOM) settled at 57 days. Homes priced between $200,000-$300,000 sold rapidly, averaging 51 days on the market, while homes under $200,000 averaged just over two months. Demand intensified for the upper price cohort, where homes over $500,000 sold after 85 days, an 8.6 percent decrease YOY.
The existing home days on market balanced at its two-year average of 52 days. Demand for resale homes in the Texas Urban Triangle persisted below the state average despite marginal upticks in the DOM. Austin and Dallas posted YTD highs at 44 and 33 days, respectively. In Fort Worth, the demand for existing homes softened as the DOM increased 7.3 percent YOY to 34 days. The Houston DOM increased 1.1 percent from 46 to 47 days, but a September shock is expected from the aftermath of hurricane. San Antonio recorded the highest DOM at 48 days, almost a week below its year-earlier level of 54 days.
Demand for new homes softened as the new home DOM jumped from 85 to 91 days after a six-month decline. The Houston DOM drove the increase, rising 9.0 percent to 97 days, but Dallas (83 days) and Fort Worth (75 days) posted similar DOM growth at 8.4 and 5.9 percent, respectively. In San Antonio, the DOM hovered around its cycle low at 81 days. Rising home prices held Austin’s DOM above the other metros, around 97 days, for the third straight month.
After stabilizing last month, interest rates returned to their downward trend amid weak inflation expectations. Waning confidence in tax and regulatory reform in Washington, combined with domestic and international political uncertainty, pulled the ten-year U.S. Treasury bond yield to a YTD low of 2.21 percent. The Federal Home Loan Mortgage Corporation 30-year fixed-rate fell for the fourth time in five months, settling at 3.88 percent. Relatively strict lending standards and regulations continued to offset the impact of the historically low interest rates.
Prices
Texas price pressures increased as the median home price rose 2.9 percent YTD. The price increase primarily occurred in the resale market, where the median surpassed $212,000 for the first time in series history. The median price for existing homes in Austin ($293,097), Dallas ($269,986), and Fort Worth ($211,907) also reached all-time highs amid shortages for homes under $300,000. The median resale price in Houston ($214,596) and San Antonio ($201,492) bounced back after retracting last month.
The statewide median price for new homes ($284,714) sold through a Multiple Listing Service fell 1.4 percent amid softer demand and supply increases. This decline pulled the premium for new homes over resales down to 34.2 percent, the lowest in series history (since 2011). New home price pressures have relaxed throughout the year in the major metros, reflecting builders’ move toward lower-priced new homes. Dallas maintained the highest median price at $340,893 but fell 7.5 percent from its February peak. Similarly, the Fort Worth median dropped to $281,906, down 8.4 percent YTD. In Houston, the median price rose above $305,000 for the first time since April and closed in on the Austin median of $312,839. The median price stabilized around $248,000 in San Antonio but contracted 7.8 percent YTD.
Despite the dip in the median price for new homes, the statewide median price per square foot (ppsf) appreciated 1.5 percent to $122.72. Rising land costs and strict regulations caused homebuilders to reduce the square footage of new homes. The average lot size for new homes sold in August was 2,327 sf, 8.0 percent smaller than the peak of 2,530 sf in 2014. The statewide median ppsf for existing homes rose to $106.98 as lot sizes shrunk, and overall prices increased.
Austin led the state in ppsf for both new and existing homes at $137.83 and $145.32 ppsf, respectively. However, the median ppsf for new homes in Dallas ($131.29) continued to converge towards Austin, rising 4.2 percent this year.
The Texas sale-to-list price ratio hovered around 0.96 for new and resale homes, indicating a seller’s market. The Austin ratio for new homes fell marginally below 0.96 while the metrics for the other metros were unchanged.
____________________
*All monthly measurements are calculated using seasonally adjusted data, and percentage changes are calculated month over month, unless stated otherwise.