
Texas Economic Indicators: Labor, Energy, Exports, Housing
Texas economic indicators point to solid expansion in April. The state posted strong job growth and record-low unemployment, indicating that labor markets remain tight.
Oil prices increased in April but have ticked down in recent weeks. The state’s exports dipped in March, while building permits for single-family housing rose.
Labor Market
Texas Employment Picks Up
Texas employment expanded an annualized 2.6 percent in April, following upwardly revised 2.5 percent growth in March (Chart 1). The state has added jobs at a 2.3 percent annualized rate year to date.
The Dallas Fed’s Texas Employment Forecast shifted up, predicting 2.3 percent job growth in 2019 (December/December), with an 80 percent confidence band of 1.3 percent to 3.3 percent.
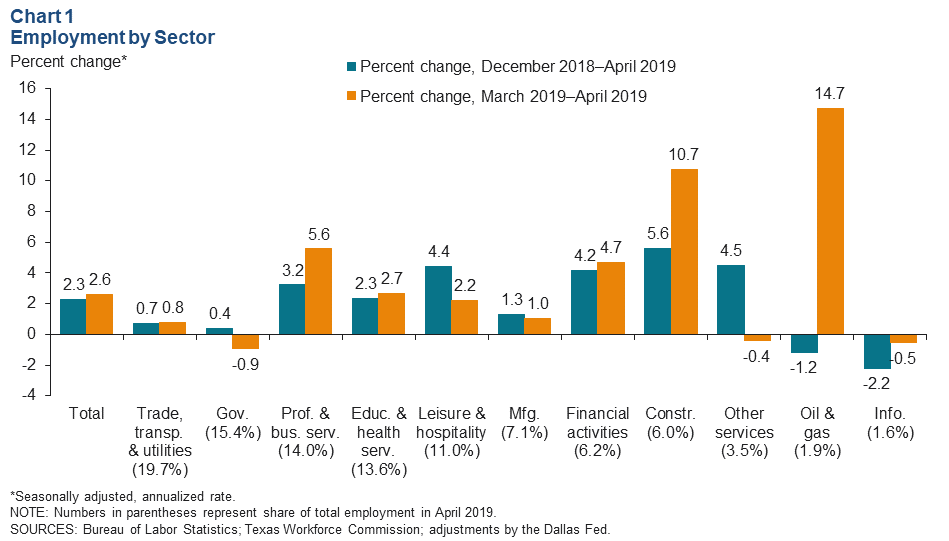
Employment gains were mostly widespread across industries in the month.

Oil and gas employment soared 14.7 percent, though it has declined year to date. Construction employment climbed 10.7 percent, bringing its year-to-date growth to a robust 5.6 percent. The government, other services and information sectors all shed jobs in the month.
April job growth was broad based across Texas’ major metros, with only Fort Worth posting a decline. Year to date, McAllen has expanded payrolls the most rapidly, followed by Dallas; only Fort Worth has shed jobs.
Unemployment Returns to Historical Low
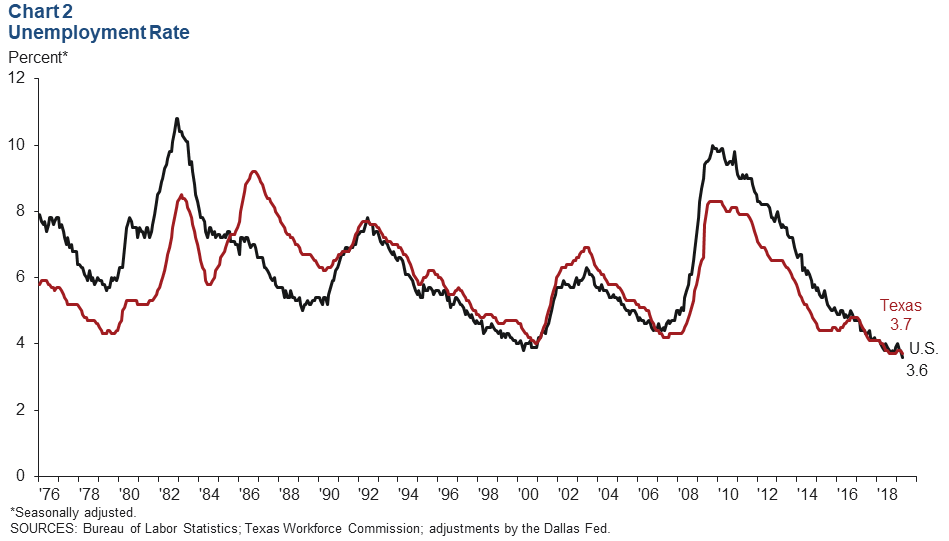
The Texas unemployment rate dipped to 3.7 percent in April, the same rate as the last five months of 2018 and the lowest rate in the four-decade history of the series (Chart 2).
The U.S. unemployment rate dropped to 3.6 percent, its lowest level since 1969.
Energy
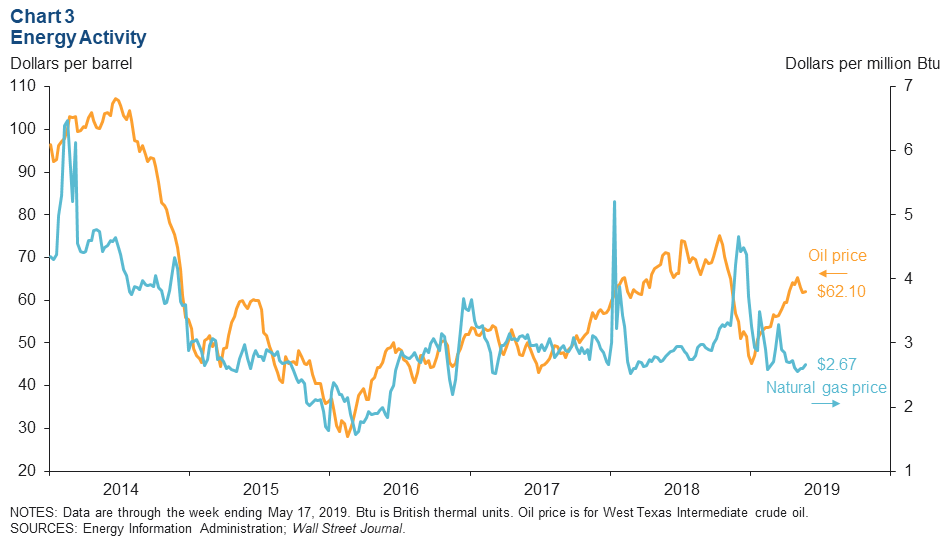
Oil prices edged up to $62.10 per barrel in the week ending May 17—17.3 percent lower than the 2018 high of $75.13 but well above the $49.96 per barrel needed on average to profitably drill new wells, according to firms responding to the Dallas Fed’s Energy Survey (Chart 3).
Natural gas prices inched up in the week to $2.67, 4.2 percent below their year-ago levels. Texas lost three rigs, bringing the rig count to 482—10.7 percent below the state’s post-oil-bust high of 540 rigs.
Exports
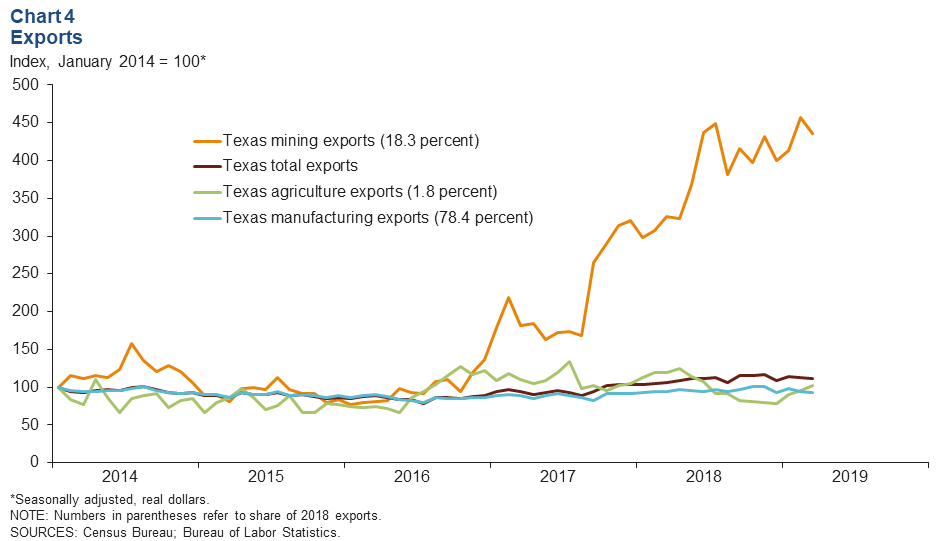
Texas exports dipped 1.6 percent in March, and exports from the rest of the U.S. inched down 0.8 percent (Chart 4).
In the first three months of 2019, compared with the same period in 2018, the state’s exports have grown 7.4 percent. Texas agricultural exports increased 6.7 percent in March, while mining exports decreased 4.5 percent and manufacturing exports slid 1.4 percent.
Texas exports to South America increased 12.3 percent in the month, the highest among major export destinations, followed by China, the rest of Asia and Africa, while exports to Europe, Central America and the Caribbean, Mexico and Canada declined.
Housing
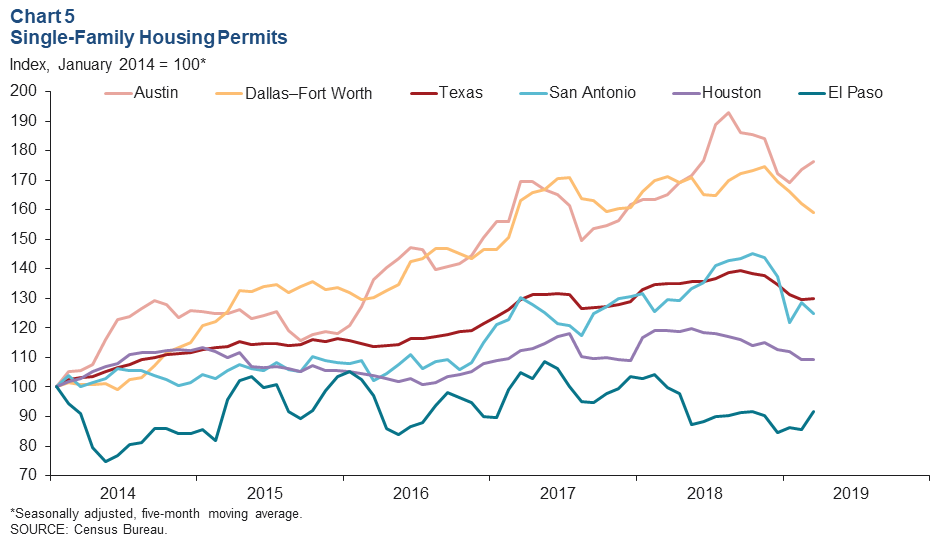
The five-month moving average of Texas building permits for single-family housing edged up 0.3 percent in March after several months of decline (Chart 5).
This year through March, 4.5 percent fewer permits have been issued in the state than during the same period last year.
Over the same period, permits expanded 8.1 percent in Austin and 4.5 percent in El Paso but declined 11.2 percent in Houston, 7.1 percent in Dallas–Fort Worth and 4.3 percent in San Antonio.
Population
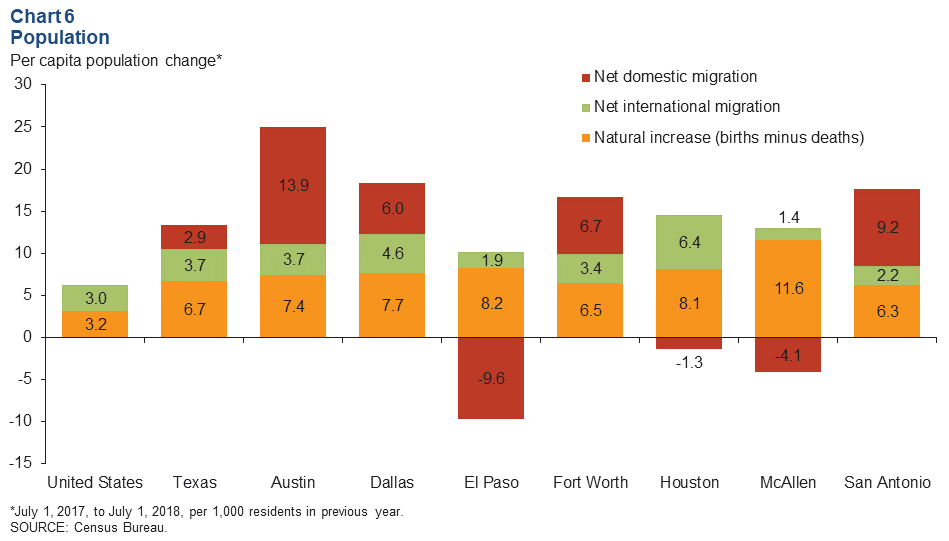
For every 1,000 residents in July 2017, Texas added 13.4 new residents by July 2018, including 6.7 net births, 3.7 net international migrants and 2.9 net domestic migrants (Chart 6).
Austin’s net domestic migration rate led the state’s major metros in the year, while McAllen had the highest rate of natural increase (births minus deaths) and Houston had the fastest net international migration rate.
Houston, McAllen and El Paso all posted negative net domestic migration—more people leaving for other regions in the U.S. than arriving from other places in the U.S.
NOTE: Data may not match previously published numbers due to revisions.
Questions on Texas Economic Indicators can be addressed to Stephanie Gullo at stephanie.gullo@dal.frb.org.


