How Much Home Can A Household Afford?
The fundamental determinants—home price and household income—have diverged since the recovery from the Great Recession, causing national and statewide declines in housing affordability.
The Real Estate Center’s Housing Affordability Index employs median family income relative to the median home price. Another measure of affordability, the Texas Affordability Pyramid (the pyramid), estimates the number of households that can afford to purchase a home at specific price intervals based on household income.

Housing affordability is broadly defined as the ability of a household (or family) earning the median income to qualify for the median-priced home. The fundamental determinants—home price and household income—have diverged since the recovery from the Great Recession, causing national and statewide declines in housing affordability.
Effects of Mortgage Interest Rates and Tax Rates on Qualifying Income
Several variables affect housing affordability, including the mortgage interest rate and the effective tax rate. High interest and tax rates decrease affordability by increasing the required income to qualify for a mortgage loan. According to the National Association of Realtors’ “2016 Profile of Home Buyers and Sellers Texas Report” (NAR Buyers/Sellers Report), 86 percent of homebuyers in Texas used mortgage debt financing in 2016. The required qualifying income determines how much home a household can purchase.
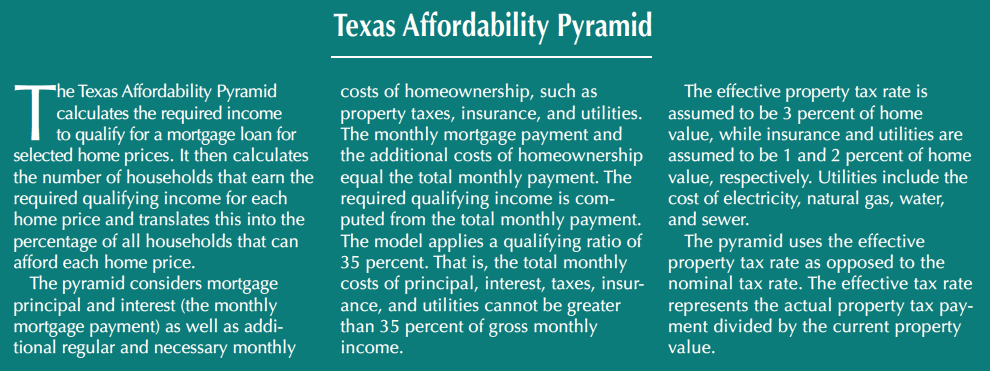
The required qualifying income varies widely based on some underlying assumptions. Under the base assumptions above, the monthly mortgage payment for a $200,000 home with a $180,000 mortgage is $874.99. The total monthly payment, which factors in the additional costs of homeownership, increases the required payment by $1,000 to $1,874.99. Property taxes are $500 ($200,000 × 0.03/12); insurance, $166.67 ($200,000 × 0.01/12); and utilities, $333.33 ($200,000 × 0.02/12) per month. Thus, the required annual qualifying income is $64,285 to purchase a $200,000 house.
Changes to the underlying assumptions, such as the mortgage interest rate and the effective tax rate, affect a household’s ability to afford the same-priced home. As the mortgage interest rate or the effective tax rate increases, the required qualifying income increases, which decreases the number of households that can afford that home. In essence, a higher required qualifying income excludes more would-be buyers from homeownership at a given price.
Under the base assumptions, of the 9.54 million households in Texas in 2016, over one-quarter of all households (28.1 percent) could not afford a home priced more than $99,999. Homeownership is not financially feasible for the substantial portion of these 2.67 million households, who often rent instead.
More than half (55.2 percent) of all Texas households could not afford a home priced at $200,000 or more. Nearly three-quarters of all households (72.6 percent) could not afford a home priced at $300,000 or more. Only 16.4 percent of all households (1.57 million) could afford a home priced at $400,000 or more (Figure 1).

If the mortgage interest rate increases to 7 percent, the monthly mortgage payment for the same $200,000 home is $1,197.54, and the total monthly payment is $2,197.54. The additional costs of homeownership remain the same. The required qualifying income escalates to $75,344 (Table 1). This near-3 percentage point increase in the mortgage interest rate raises the required qualifying income by over $10,000.
A decline in the mortgage interest rate to 3 percent reduces the monthly mortgage payment to $758.89 and the total monthly payment to $1,758.89, and the required qualifying income to $60,305. For the same $200,000 home, this 4 percent difference in the mortgage interest rate (from 3 to 7 percent) produces a $15,039 range for the required qualifying income.
Changes to the effective tax rate follow a similar pattern. Using the base assumptions, the total monthly payment is $1,874.99, of which the tax payment is $500. If the effective tax rate were 1 percent, the monthly mortgage payment remains the same ($874.99), but the total monthly payment decreases to $1,541.65. The tax payment declines to $166.67 per month or $2,000 per year.
If the effective tax rate equals 5 percent, the total monthly payment increases to $2,208.32. The tax payment rises to $833.33 per month or $10,000 per year. The required qualifying income increases from $52,857 at a 1 percent tax rate to $75,714 at a 5 percent tax rate (Table 2). For the same $200,000 home, this 4 percentage point difference in the effective tax rate (from 1 to 5 percent) produces a near-$23,000 range in the required qualifying income.

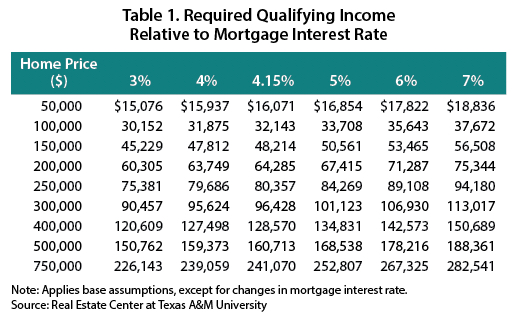
As the interest rate increases, the number of households priced out of homeownership at each price interval increases (Table 3). If the interest rate were 7 percent, over three-fifths (62.4 percent) of households could not afford a home priced at $200,000 or more. This translates into 5.95 million households that could not afford a home priced at $200,000 or more.
If the interest rate was 3 percent, 52.4 percent of all households could not afford a home priced $200,000 or more. The number of households that could not afford a home at the $200,000 level declines to five million at a 3 percent interest rate. Under the base assumptions, nearly one million more households are priced out of homeownership at the $200,000 level if the interest rate increased to 7 percent instead of 3 percent.
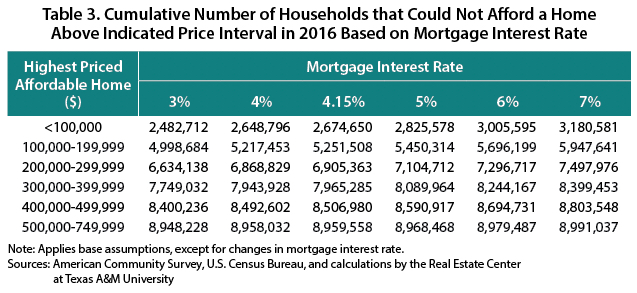
Similar to the mortgage interest rate, if the effective tax rate increases, the number of households priced out of homeownership increases. At an effective tax rate of 5 percent, 62.5 percent of households (5.96 million) could not afford a home priced at $200,000 or more.
If the effective tax rate was 1 percent, only 46.5 percent of all households (4.43 million households) could not afford a home priced at $200,000 or more. Under the base assumptions, 1.53 million more households are priced out of homeownership at the $200,000 level if the tax rate increases from 1 to 5 percent (Table 4).
Clearly, the greatest impact of changes to the effective tax rate on housing affordability is at the lower price levels.
Down Payment Effect on Affordability
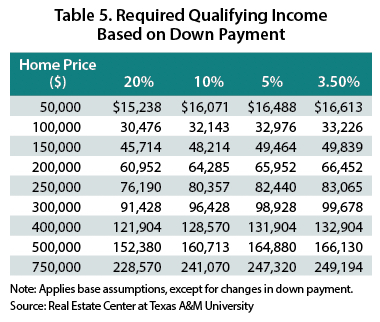
Changes to the down payment also affect housing affordability. A higher down payment actually results in higher affordability. A lower down payment increases the monthly mortgage payment and dictates that households must earn a higher required qualifying income to purchase the same-priced home (Table 5). Under the base assumptions, a household must earn $64,285 to qualify for a $200,000 home. The household must earn $65,952 to qualify for the same-priced home with a 5 percent down payment and $66,452 with a 3.5 percent down payment.
As the down payment decreases, the number of households that could not afford a home at each price interval increases (Table 6). With a 20 percent down payment, 52.9 percent of households (5.04 million households) could not afford a home priced at $200,000 or more. This portion increases to 55.1 percent (5.25 million households) with a 10 percent down payment, 56.2 percent (5.36 million households) with a 5 percent down payment, and 56.5 percent (5.39 million households) with a 3.5 percent down payment.
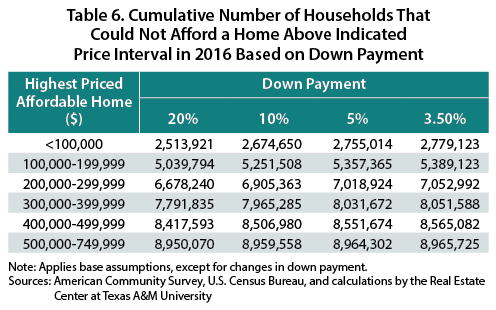
This 16.5 percentage point decline in the down payment (from 20 to 3.5 percent) produces a 3.6 percent increase in the number of households that could not afford a home priced at $200,000 or more. Under the base assumptions, this seemingly modest increase translates into an additional 349,329 households that could not afford a home priced at $200,000 or more.
Households Priced Out of Homeownership
The pyramid also measures the impact of incremental increases in home price on housing affordability. For each increase in home price, a certain number of households are priced out of homeownership. The pyramid calculates the average number of households that could not afford a $1,000 increase in home price (Figure 2).

Increases in home price disproportionately affect lower-income households. A greater number of households could not afford a $1,000 increase in home price at lower price intervals. The average number of households that could not afford a $1,000 increase in home price decreases as the home price increases.
An average of 30,735 households could not afford a $1,000 increase in home price in the $75,000 to $100,000 price interval. (For the required qualifying income corresponding to each home price, refer to the base assumptions in Table 1.) An average of 28,018 households could not afford a $1,000 increase in home price in the $100,000 to $150,000 price interval. This average decreases to 23,519 households in the $150,000 to $200,000 price interval, 19,769 households in the $200,000 to $250,000 price interval, 9,327 households in the $250,000 to $500,000 price interval, and 1,810 households in the $500,000 to $750,000 price interval.

Home Purchase Maltiplier
The home-purchase multiplier, or the ratio of home price to required qualifying income, provides another perspective on affordability. For the same-priced home, a lower required qualifying income increases the home-purchase multiplier. Affordability increases as the multiplier increases because the required qualifying income decreases relative to home price. A higher multiplier effectively implies that buyers can purchase more housing per dollar of income.
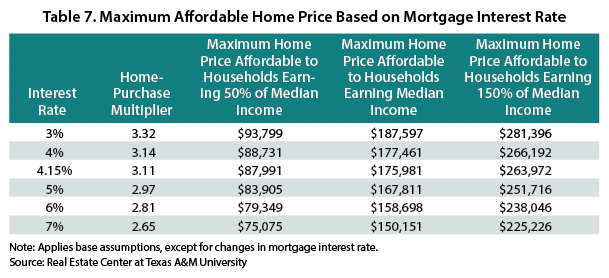
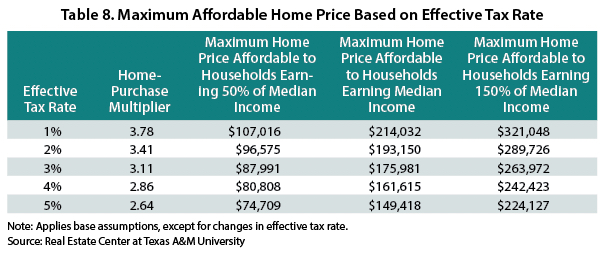
Tables 7 and 8 depict the home-purchase multipliers at different mortgage interest rates and effective tax rates, respectively. As either rate increases, the multiplier decreases. This means that buyers can purchase less housing relative to income. As the multiplier declines, homebuyers must earn higher incomes to purchase the same-priced home.
As the down payment decreases, the multiplier decreases (Table 9). Homebuyers must compensate for the smaller initial outlay of cash through a higher required qualifying income to purchase the same-priced home.

Changes to the mortgage interest rate, effective tax rate, and down payment affect the maximum home price a particular household can afford. As the mortgage interest rate increases, the maximum home price a household can afford decreases. An increase in the interest rate from 3 to 5 percent decreases the home-purchase multiplier from 3.32 to 2.97. This means that for a household earning the median statewide income in 2016 ($56,565), the maximum home price affordable for that household decreases from $187,597 ($56,565 × 3.32) to $167,811 ($56,565 × 2.97).
Based on an increase in the interest rate from 3 to 5 percent, for a household earning 50 percent of the median income ($28,283), the maximum home price affordable for that household declines from $93,799 to $83,905. For a household earning 150 percent of the median income ($84,848), the maximum home price affordable for that household declines from $281,396 to $251,716.
Changes to the effective tax rate follow a similar pattern. If the effective tax rate increases from 2 to 4 percent, the maximum home price affordable for a household earning the median income decreases from $193,150 to $161,615. In this instance, the home-purchase multiplier declines from 3.41 at a 2 percent effective tax rate to 2.86 at 4 percent. Even a seemingly small change in the home-purchase multiplier significantly affects housing affordability.
As the down payment decreases, the maximum home price a household can afford also decreases. If the down payment decreases from 10 to 5 percent, the maximum home price affordable for a household earning the median income decreases from $175,981 to $171,534. According to NAR’s Buyers/Sellers Report, the median percent of the purchase price financed by all homebuyers in Texas was 94 percent in 2016. This equates to a 6 percent down payment, which actually dampens housing affordability. Households that are able to outlay a larger down payment can also qualify for a higher-priced home.
Under the base assumptions, a household earning the median statewide income in 2016 could afford a maximum home price of $175,981. However, in 2016, the statewide median sales price was $210,000. Under the base assumptions, 57.2 percent of households in Texas could not afford to pay the median sales price in 2016. If growth in the median sales price continues to outpace household income growth, the share of households that cannot afford the median-priced home will increase. This would price more would-be buyers out of homeownership.
__________
This story was originally published by the Real Estate Center, Texas A&M University. The Center’s staff conducts research on financial, socioeconomic, public policy, trade, legal, land use and local market analysis issues related to real estate. The Center is the nation’s largest publicly funded organization devoted to real estate research. Dr. Gaines (jpgaines@tamu.edu) is chief economist and Losey a research assistant with the Real Estate Center at Texas A&M University.