San Marcos Added Over $118 Million Of Debt In One Year, A 44 Percent Increase Year-Over-Year
The City of San Marcos property tax rate is higher than the City of Austin’s, and San Marcos elected officials are spending your tax dollars quicker than residents can turn it over to them.
![]()
Recently the Texas State Comptroller’s office released their 2016 “Debt at a Glance” for cities and counties throughout Texas, and this is the second year that Corridor News has made this information available to its readers. (Read last year HERE.)
San Marcos just made it through an election, but if there is one thing residents can all count on, is another election is right around the corner, and here is some information everyone should know.
The City of San Marcos property tax rate is higher than the City of Austin’s, and San Marcos elected officials are spending residents tax dollars quicker than you can turn it over to them.
All residents, meaning every man, woman and child in San Marcos will be on the hook for this debt, so before the next election hits, residents should be aware how elected officials are spending money.
Corridor News will be doing a series on City of San Marcos debt we plan to bring to you over the next month.
Additionally, we will be releasing the debt for Hays County, ALL cities in Hays County, Hays CISD and San Marcos CISD.
NOTE: The 2017 City of San Marcos Bond Election that was held this last in May of this year is NOT included in the totals below as the Texas Comptroller’s office runs one year behind.
NOTE: ALL the information provided on the page is from the Texas State Comptroller office and you can find it on their website HERE.
Here is the amount of debt for the City of San Marcos as of August 31, 2015, (Read last year’s report HERE.)
![]()
A side-by-side comparison of San Marcos’ 2015 and 2016 debt
![]()
| 2015 Population | 58,892 | 2016 Population | 61,980 |
|---|---|---|---|
| Population % Change 2005-2014 | 48.4% | Population % Change 2007-2016 | 16.9% |
| Tax-Supported Debt | $232,240,000 | Tax-Supported Debt | $351,197,318 |
| Revenue-Supported Debt | $38,110,000 | Revenue-Supported Debt | $37,831,732 |
| Lease-Purchase Obligations | $0 | Lease-Purchase Obligations | $0 |
| 2015 Total Debt | $270,350,000 | 2016 Total Debt | $389,029,050 |
| Debt Per Capita 2015 | $3,943 | Debt Per Capita 2016 | $5,666 |
Source: Texas Bond Review Board
![]()
![]()
The definitions of the three types of debt
Tax Supported Debt
Tax-supported debt is backed by a pledge of property taxes levied within the issuer’s boundaries. Some tax-supported debt may be secured by a combination of property taxes and other revenue sources. It generally must be voter-approved (with exceptions for COs, tax notes, school district maintenance tax notes, and certain county road bonds and contractual obligations for personal property.)
Revenue Supported Debt
Revenue-supported debt is secured by non-property tax revenue such as sales tax, tuition, admissions to athletic events, tolls, or water, gas, or electric municipal utility charges. As used in this site, it does not include debt that is also payable from property taxes. Revenue-supported debt generally does not require voter approval.
Lease-Purchase Obligations
Lease Purchase is financing the purchase of an asset over time through lease payments that include principal and interest. Lease purchases can be financed through a private vendor.
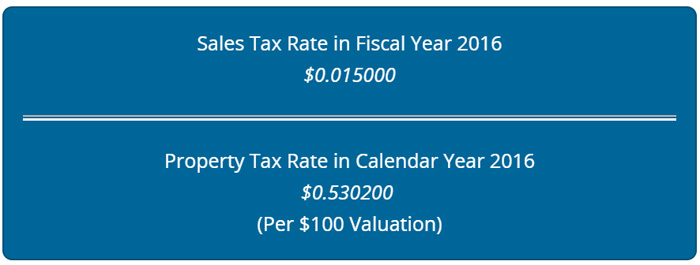
City of San Marcos Sales Tax Rate and Property Tax Rate
In September the San Marcos City Council raised the property tax rate to .6139 cents per $100 of property valuation, which is not included in the report from the Comptroller’s office.
NOTE: City of Austin’s property tax rate within the new budget is .4448 cents per $100 of property valuation…..which is less than the City of San Marcos. Read more HERE.
Tax-Supported Debt Outstanding for Cities of Similar Size, as of August 31, 2016
What is Tax Supported Debt?
Tax Supported Debt Outstanding Per Capita is the total debt divided by the population. The amount owed by every man, woman and child living in each of the cities.
Below you will notice that the City of San Marcos has the highest debt of the cities with similar population.
Can’t see the whole table? Touch it and scroll right.
| City Name | Tax Supported Debt Outstanding | Tax Supported Debt Outstanding Per Capita | Population |
|---|---|---|---|
| Cedar Park | $270,292,084 | $3,922 | 68,918 |
| Victoria | $117,369,430 | $1,734 | 67,670 |
| Georgetown | $224,333,679 | $3,341 | 67,140 |
| Mansfield | $153,675,365 | $2,342 | 65,631 |
| Harlingen | $45,569,201 | $695 | 65,539 |
| Rowlett | $95,189,116 | $1,535 | 61,999 |
| San Marcos | $351,197,318 | $5,666 | 61,980 |
| Pflugerville | $346,453,245 | $5,848 | 59,245 |
| Port Arthur | $64,441,379 | $1,163 | 55,427 |
| Euless | $65,370,151 | $1,194 | 54,769 |
Source: Texas Bond Review Board, U.S. Census Bureau – Note: The table includes San Marcos and nine cities with closest population numbers based on 2016 U.S. Census Bureau population data. Tax-supported debt does not include revenue debt and lease-purchase obligations. For cities with municipal gas and/or electric utilities, regional airports, or other capital assets not common to cities generally, Tax-Supported Outstanding Debt may include debt for infrastructure that in other cities is carried by private enterprises, a public facility corporation or not at all.
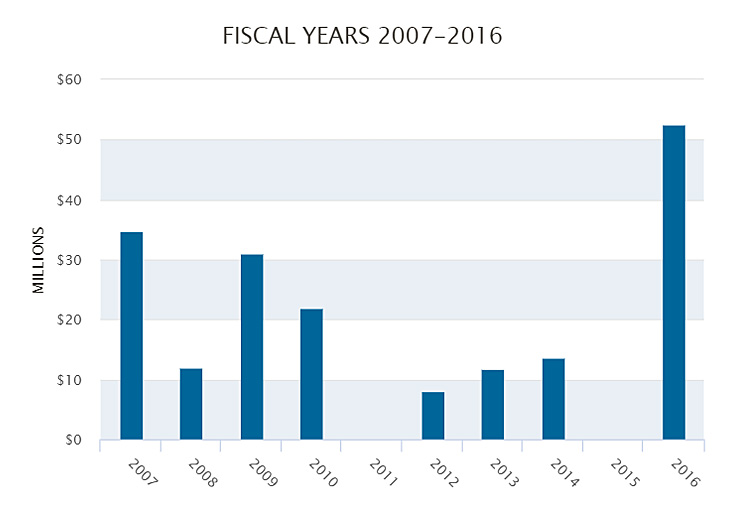
Certificates Of Obligation Issuances
What’s this?
Certificates of Obligation (COs) allow certain cities, counties and hospital or health districts to issue debt without voter approval (unless a referendum is petitioned) and are backed by tax revenue, fee revenues or a combination of the two.
- City of San Marcos had no recent bond elections. Visit our bond election roundup to see all local bond election results from May 2013 or later.
Source: Texas Bond Review Board – Note: Amounts are estimates and have not been adjusted for inflation or population growth. The Bond Review Board has reconciled Certificates of Obligation issuances from 2003 through 2016.
Debt Trends
NOTE: The percentages below were through September 2016 and before the San Marcos City Council put forth the Bond Election in May 2017 for the San Marcos Public Library and Public Safety totaling $32.2 million.
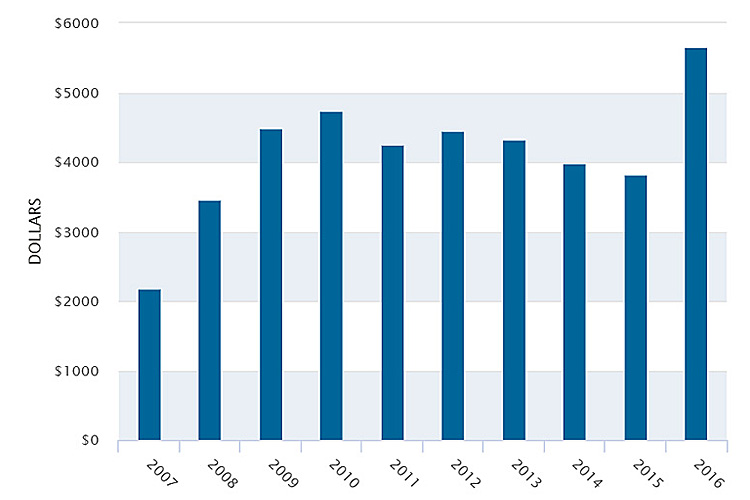
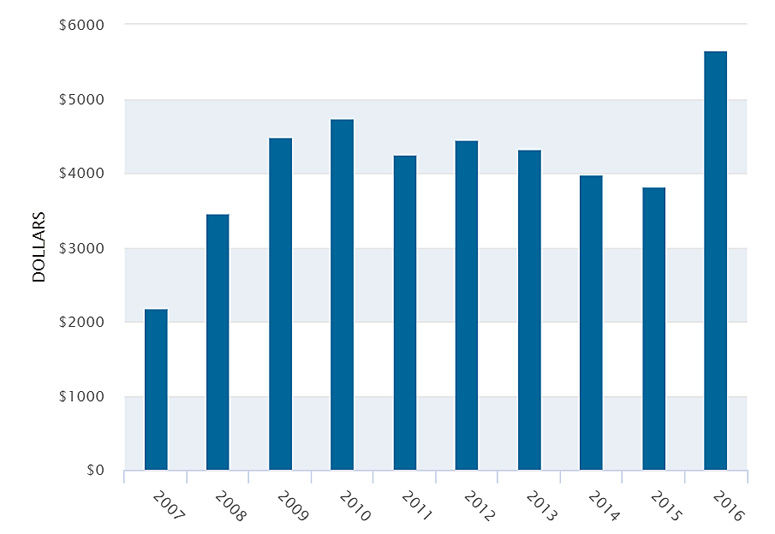
San Marcos Tax-Supported Debt Per Capita Outstanding at Fiscal Year End: 10-Year Trend
NOTE: The totals below were through September 2016 and before the San Marcos City Council put forth the Bond Election in May 2017 for the San Marcos Public Library and Public Safety totaling $32.2 million.

Sources: Texas Bond Review Board, U.S. Census Bureau, Bureau of Labor Statistics – Note: Reflects debt in 2016 dollars divided by estimated population in the relevant year. Some debt issued before 2003 may not be reflected.
An Introduction to Understanding
NOTE: The City of San Marcos will not release fiscal year 2017 until sometime in March of 2018.
Comprehensive Annual Financial Reports
When you’re ready to learn about a public entity’s fiscal health, you’ll find a great deal of information in comprehensive annual financial reports (CAFRs) and other yearly reports. Often posted online alongside other financial information, CAFRs report an entity’s accounting statements, debts and other key information for the past year.
But sometimes that information can be tricky to find – and tough to understand. Because of that, our office compiled some tips for locating an entity’s CAFRs and for understanding them. You’ll learn how all CAFRs have certain similarities and when and why different entities’ CAFRs will differ in key ways. Plus, we detail strategies for pinpointing the debt, expenditure and revenue information you need to hold a government entity accountable.
Note that the data in the following publications is presented as of the dates indicated in the publications and may not reflect debt, population or other data as of any subsequent date. For further or more current information, see the applicable entity’s web site or its most recent filings at Electronic Municipal Market Access (EMMA®). The Comptroller does not control or guarantee the accuracy, completeness, or currency of any such site. When you access any such site, you will be leaving the Comptroller’s website.
Read the Texas Comptroller’s Guide to Understanding Comprehensive Annual Reports (CAFRs)
Download 2016 city debt data. (XLSX)
To learn more about the finances of public pension plans that may operate in this jurisdiction, please visit the Texas Comptroller’s public pension search tool.
Texas Comptroller Disclaimer: The data below from the Texas Comptroller is provided as of the date indicated and may not reflect debt, population or other data as of any subsequent date.
In addition, the debt is shown for the city only, and not for other political subdivisions that may have outstanding debt, taxing powers and the same boundaries as the city.
For more information on the different types of debt by municipalities, refer to our Debt Glossary.


