Texas Housing Insight
Austin maintained the highest median price at $291,433, rising 2.8 percent year to date. The statewide median price for new homes ($287,949) sold through a Multiple Listing Service rose 1.5 percent despite recent supply increases.
James P. Gaines, Luis B. Torres, Wesley Miller, and Bailey Cuadra (Sep 4, 2017)
![]()
July 2017 Summary
This review does not account for the impacts of Hurricane Harvey and the ensuing recovery process but reflects the market through July.
The Texas housing market stepped back because of supply constraints. Shortages for homes under $300,000 dragged total housing sales down 5.1 percent on a seasonally adjusted basis. Tight inventories persisted primarily in the resale market, whereas the supply of new homes continued to catch up to demand. Resale conditions were most extreme in Dallas where the supply of listings fell to 2.1 months, and the average home sold in less than a month.
Supply*
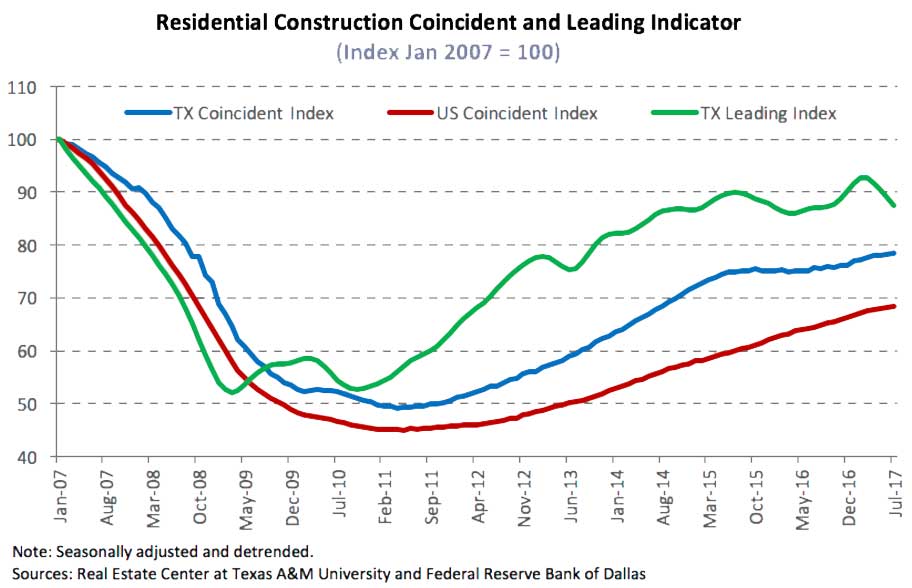
The Texas Residential Construction Cycle (Coincident) Index, which measures current construction activity, inched forward due to favorable residential construction employment trends. The Texas Residential Construction Leading Index (RCLI) dipped as multifamily construction declined, signaling a slowdown in the residential construction business cycle.
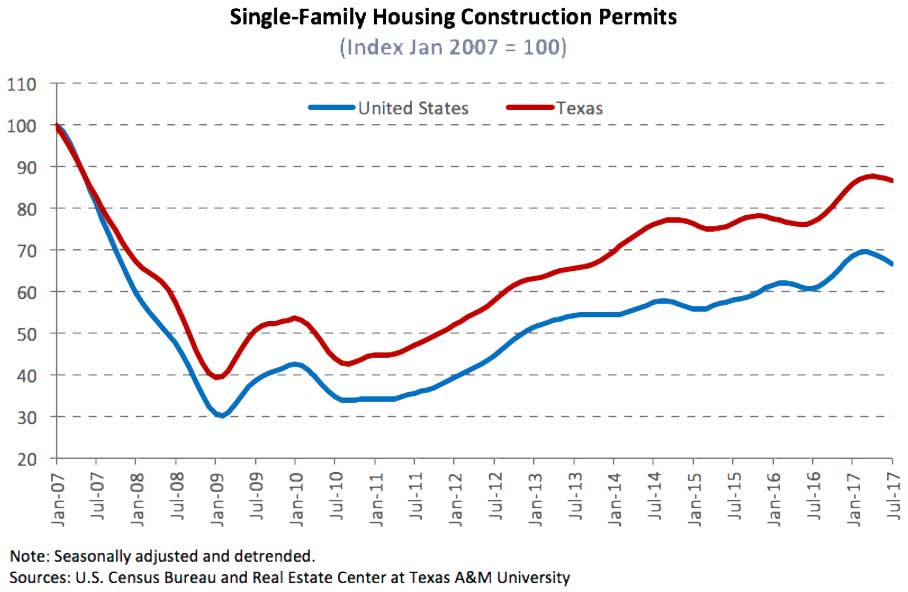
Statewide, single-family housing construction permits dropped 6.9 percent but maintained 13.1 percent year-over-year growth. Texas led the country in total permits issued and was sixth when ranked by permits per capita. Houston and Dallas remained the national leaders, issuing 3,439 and 2,966 nonseasonally adjusted permits respectively, accounting for two-thirds of the Texas total. In Austin, single-family permits slid 12.0 percent, down 25.4 percent from its cycle-high in January. Permits trended upward in Fort Worth despite the second straight monthly decline.
Single-family housing starts trended upward but failed to negate large declines in multifamily construction. Total Texas housing starts dropped 27.1 percent since March, retracting nearly all of its first quarter gains. Single-family private construction values, which closely track housing starts, dropped 8.6 percent in Texas, falling in all the major metros. Despite the stutter, most of the metros maintained their upward trend. San Antonio was the exception, where construction values declined 25.1 percent year to date and 8.3 percent year over year.
The Texas months of inventory (MOI) held steady at 3.9 months; around six months is considered a balanced housing market. Despite recent supply improvements, the MOI distribution between price cohorts widened, intensifying affordability concerns. Specifically, the MOI for homes priced less than $200,000 fell to 3.0 months, while expanding to 4.5 months for homes between $300,000-$400,000 and 5.7 months for homes between $400,000-$500,000. Additionally, the MOI for homes over $500,000 remained at ten months.
Differences between the resale and new home markets explain much of the MOI variation. In general, resale homes are less expensive than newly constructed equivalents. Therefore, existing home shortages strain the supply of inexpensive housing. In July, the Texas MOI for existing homes ticked down to 3.5 months after marginal second-quarter growth. Fort Worth, Dallas, and Austin maintained exceptionally low inventories at 2.0, 2.1, and 2.1 months, respectively. In contrast, San Antonio posted its fifth straight MOI increase, reaching 3.2 months. Houston held the largest supply of listings at 3.8 months amid its recent economic recovery.
The number of new listings in Texas advanced as the new home MOI reached 5.4 months, the highest since 2011. Austin and Houston approached the state average, increasing to 5.3 months, respectively. The MOI settled at 4.7 months in Dallas and San Antonio, and at 4.4 months in Fort Worth. Supply conditions continued to normalize for new homes but have not offset the resale market imbalances.
Demand
Shortages of homes priced under $300,000 dragged total housing sales down 5.1 percent on a seasonally adjusted basis. Sales fell over 4.5 percent in every price cohort, more than 70 percent of which occurred for homes under $300,000. All of the major metros experienced the sales stumble but maintained positive year-over-year growth. Pronounced resale shortages in Dallas pulled the long-term trend downward with little relief in sight.
Despite falling sales, Texas housing demand remained strong as the average days on market (DOM) fell to 56 days. Homes priced between $200,000-$300,000 sold rapidly, averaging 50 days on the market, one day faster than in June. Homes under $200,000 sold after an average of 59 days, 3.8 percent faster than last year’s average.
The Dallas existing home days on market (DOM) fell below 30 days, posting the lowest level in Texas. Strong demand throughout the Texas Urban Triangle pulled the statewide DOM down to 51 days. The Fort Worth DOM settled at 33 days, down 3.1 percent on the year. Houston demand bounced back, driving the DOM below 50 days after last month’s uptick. Additionally, the DOM was unchanged in Austin and San Antonio at 43 and 51 days, respectively.
The shortage of existing homes pushed demand into the new home market, driving the new home DOM down to 85 days. New homes in Fort Worth (69 days) sold two weeks faster than the Texas average, falling 10.8 percent year over year. The Dallas (75 days) and San Antonio (80 days) DOM remained below the statewide average and trended downward. Houston maintained a slightly higher DOM at 89 days but declined 11.4 percent relative to February. Rising home prices held Austin’s DOM above the other metros at 97 days but fell steadily in the first half of the year.
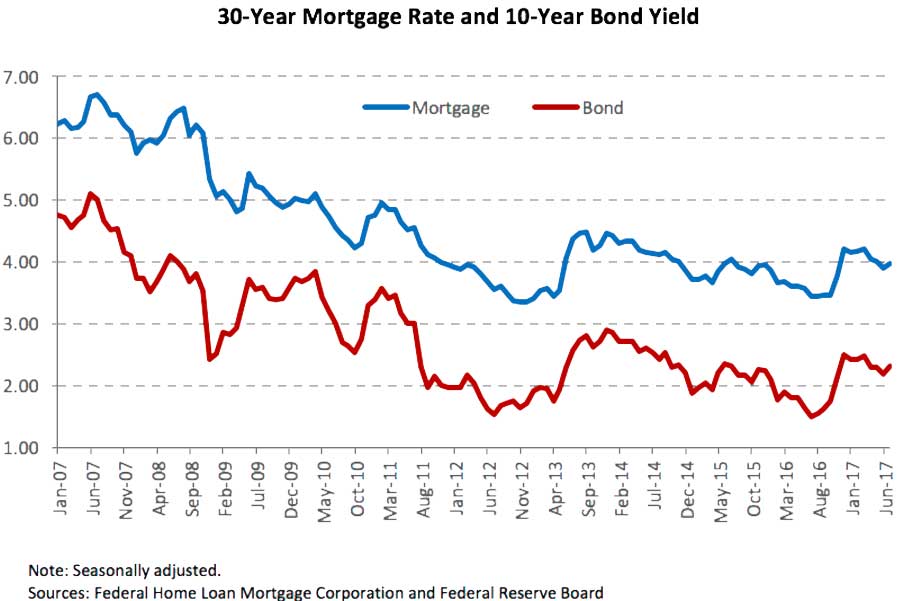
Despite weak inflation, interest rates rebounded after falling to year-to-date lows in June. While overall prices were flat, the uptick in oil prices and strong corporate earnings pushed the ten-year U.S. Treasury bond yield to a monthly average of 2.32 percent. The Federal Home Loan Mortgage Corporation 30-year fixed-rate inched up to 3.97 after a three-month decline. However, relatively strict lending standards and regulations continued to offset the impact of the historically low interest rates.
Prices
Texas price pressures were stable as median home price growth ticked up 1.8 percent year-to-date. In the resale market, the median hovered around $210,000 for the fourth straight month but increased in the hottest markets. The median resale price jumped 1.3 percent in Dallas and 1.7 percent in Fort Worth ($209,803). Austin maintained the highest median price at $291,433, rising 2.8 percent year to date. Higher inventories in Houston ($211,321) and San Antonio ($198,657) pulled the median price down 0.9 and 2.2 percent, respectively on a seasonally adjusted basis.
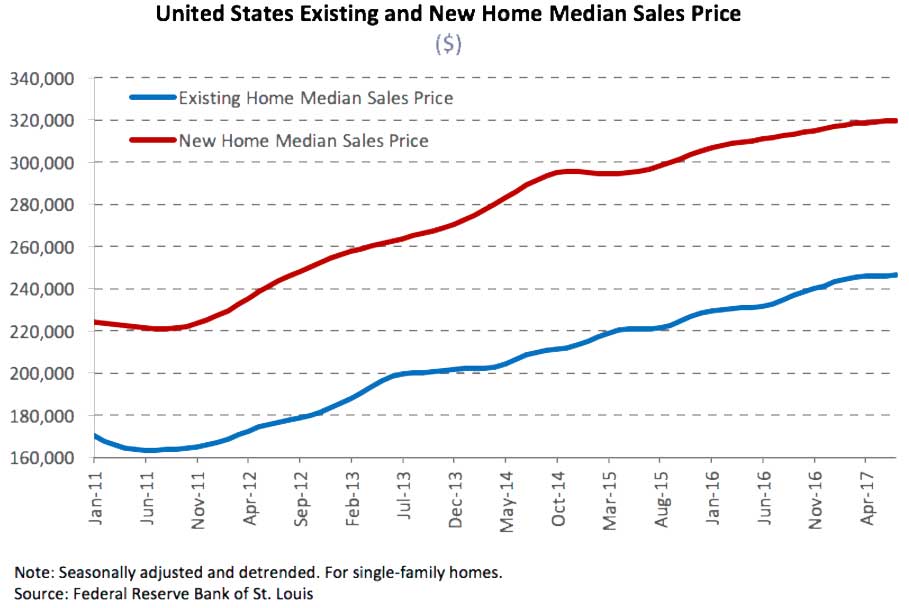
The statewide median price for new homes ($287,949) sold through a Multiple Listing Service rose 1.5 percent despite recent supply increases. This increase pushed the premium for new homes over resales up to 37.4 percent, still well below its 46.7 percent average since 2011. In contrast to the state level, most of the major metros recorded declines in the median new home price, reflecting builders’ move toward more lower-priced new homes. The median dropped $12,900 in Fort Worth ($285,806) and $7,800 in Dallas ($352,134) and fell to $246,018 in San Antonio, down 8.7 percent year to date. The Houston median stabilized at $296,306 after falling the last five straight months. In Austin ($303,655), the median price contracted year over year for the first time in 2017 and fell 4.6 percent year to date.
The statewide median price per square foot (ppsf) appreciated a quarter of a percent in the existing home market to $105.59 ppsf, while the new home median ppsf was 14.2 percent higher at $120.62 ppsf. Rising land costs and strict regulations caused homebuilders to reduce the square footage of new homes. In 2014, the median square feet for new homes averaged 2,459 sf, 3.8 percent larger than the June median of 2,366 sf. Austin led the state in ppsf for both new and existing homes at $140.52 and $146.02 ppsf, respectively. However, the median ppsf for existing homes ($123.16) in Dallas continued to converge towards Austin, rising 4.1 percent this year.
The Texas sale-to-list price ratio hovered around 0.96 for new and resale homes, indicating a seller’s market. The Houston metric settled below the state average at 0.94 and 0.95 for new and existing homes, respectively. Resale ratios were higher than those for new homes in Austin, Dallas, and Fort Worth. However, recent supply growth in Houston and San Antonio caused resale ratios to fall below the new home metrics.
![]()
![]()
![]()
![]()
 _________________
*All monthly measurements are calculated using seasonally adjusted data, and percentage changes are calculated month over month, unless stated otherwise.
This story originally published by Real Estate Center – Texas A&M University.