Staff Reports
EDITORIAL NOTE
According to the CDC, the State of Texas and Hays County Public Health all give the same disclaimer on all current counts and totals. “The Coronavirus (COVID-19) is a very fluid situation, and it will continue to be. All case numbers and totals are subject to change. As new information becomes available, we will publish those updates.”
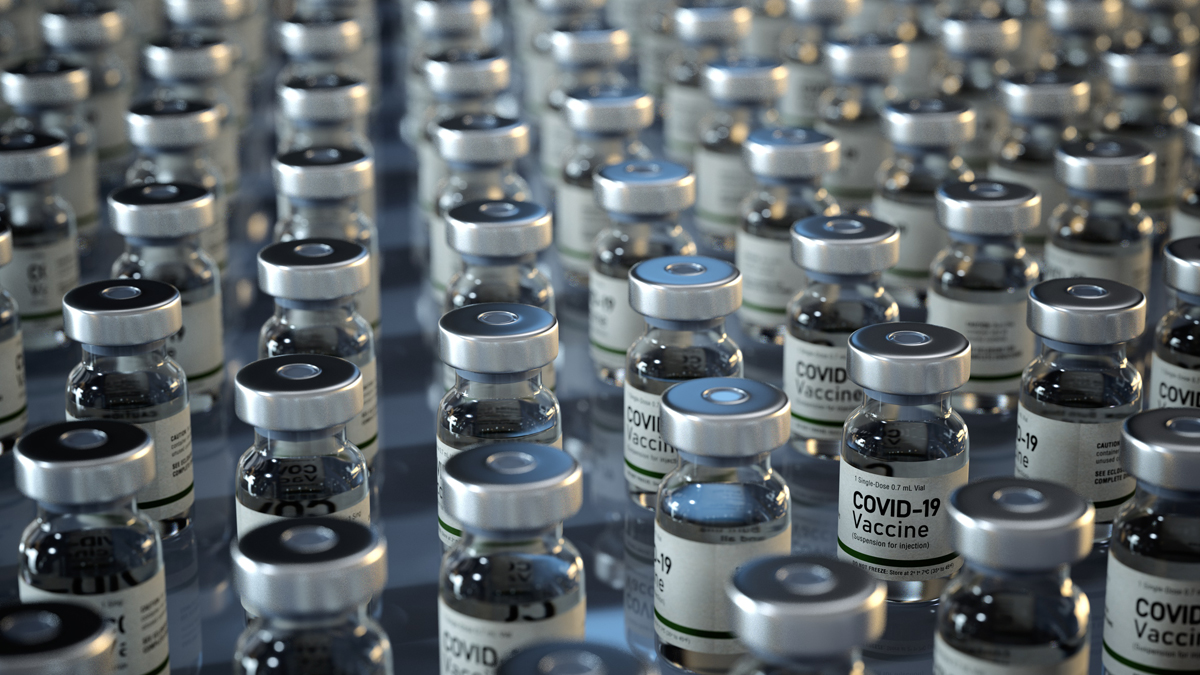
According to the Texas Department of State Health Services (DSHS), Texas will receive more than 1 million COVID-19 vaccines, and Hays County 4,680 in weekly vaccine allocations.
DSHS reported that Hays County had vaccinated 28,820 with a single dose, and an additional 15,081 have received their second dose.
Out of 254 Texas counties, Hays County is the 17th highest population that falls into Phase 1B for ages 16-65 with any medical condition.
The vaccine will be shipped to providers across Texas next week. The state is allocating 929,320 doses to 1,651 providers in 234 counties.
More than 200,000 additional doses will be available to pharmacy locations and federally-qualified health centers directly from the federal government.
The significant increase is largely due to a supply of 245,200 doses of the new Johnson & Johnson vaccine coming to the state.
The single-dose vaccine was authorized last weekend by the FDA and began shipping this week with 24,000 doses delivered to providers participating in the federally-supported vaccination sites in Arlington, Dallas, and Houston.
Texas has now administered nearly 6.3 million doses. More than 4 million people have received at least one dose, and more than 2.2 million are fully vaccinated.
Progress continues in vaccinating adults 65 years old and older with 48 percent having received at least one dose and more than 1 million seniors – more than one-quarter of the Texans in that age group – now fully vaccinated.
In addition to the first doses mentioned above, the state is ordering 457,000 doses intended as the second dose for people first vaccinated a few weeks ago.
DSHS automatically orders second doses to arrive at providers in the week they can begin to be administered, so they will be available when needed.
People should be able to return to the same provider to receive their second dose within six weeks of getting the first.
Texas continues to vaccinate health care workers, residents of long-term care facilities, people 65 and older, and those with medical conditions that put them at greater risk of hospitalization and death from COVID-19.
This week, the state added school and child care workers to the list of people eligible to be vaccinated.
According to a federal directive, the action means that “those who work in pre-primary, primary, and secondary schools and those who work as or for licensed child care providers” may now be vaccinated by any vaccine provider in Texas.
People can find more information on the COVID-19 vaccine at dshs.texas.gov/covidvaccine/.
ADDITIONAL VACCINE INFORMATION & HELPUL LINKS
RELATED HAYS COUNTY & TEXAS VACCINE STORIES

 .
.
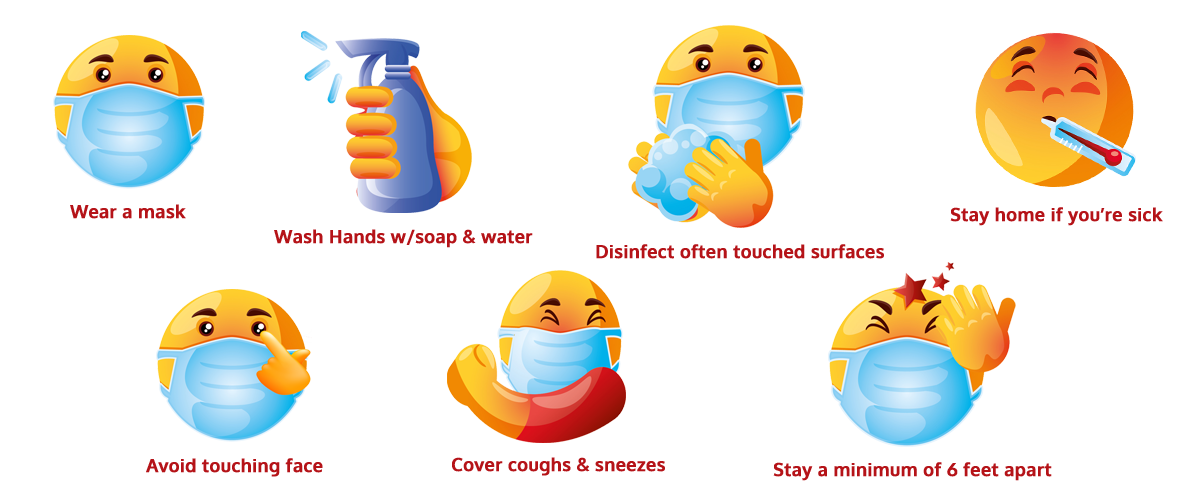
Not only for your safety but the protection of others, please follow the following guidelines.
.

.


.
NOTE: HAYS COUNTY CASE STATS & INFORMATION UPDATED THURSDAY, MARCH 11, AT 3:43 PM.
HAYS COUNTY & COVID-19: THE AFFECTS
* Disclaimer: As this is a fast-moving situation, the information included below is provisional and subject to change.
*If listed as NR, the latest information has not been released by Hays County; the table will be updated when the data is available. Coronavirus case and demographic stats are reported Monday – Friday exclusively. No case stats will be given on weekends and holidays.
HAYS COUNTY CORONAVIRUS DAILY UPDATE
HAYS COUNTY POPULATION: 230,191
HAYS COUNTY
|
MARCH 10, 2021 |
MARCH 11, 2021 |
FATALITY %
|
|
|
COVID POSITIVE TEST %
|
|
|
| COVID NEGATIVE TEST % |
|
|
HOSPITALIZATION %
|
|
|
RECOVERED %
|
|
|
| TOTAL TESTS (*provisionary / includes pending cases) |
|
|
| NEW DAILY TESTS (*provisionary) |
802 |
754
|
TOTAL LAB CONFIRMED
(*provisionary) |
|
|
| ACTIVE (*provisionary) |
499 |
473
|
| NEW DAILY CONFIRMED |
23 |
36
|
| PROBABLE CASES |
1,837 |
1,839
|
| TOTAL RECOVERED |
|
|
| DAILY RECOVERED |
83 |
60
|
| CASES REMOVED (*Reported On Fridays) |
N/A |
N/A |
| FATALITIES |
229 |
231
|
| TESTED NEGATIVE (*provisionary) |
131,735 |
132,453
|
| TOTAL HOSPITALIZATIONS |
762 |
764
|
| CURRENT HOSPITALIZATIONS |
12 |
10
|
BY CITY
HAYS COUNTY POPULATION: 230,191
*Hays county public health updates the following information Monday – Friday only
*Note: the totals and percentage rates below include “probable cases.” percentages may be rounded up.
| CITY |
CASE TOTALS
|
ACTIVE CASES
|
RECOVERED |
FATALITIES |
| AUSTIN |
499 |
22
|
467 |
10
|
| BEAR CREEK |
4 |
0 |
4 |
0 |
| BUDA |
2,956 |
113 |
2,808 |
35 |
| CREEDMOOR |
3 |
0 |
2
|
1 |
| DRIFTWOOD |
208 |
7 |
200 |
1 |
| DRIPPING SPRINGS |
777 |
39 |
729 |
9 |
| HAYS |
3 |
0 |
3 |
0 |
| KYLE |
5,380 |
112 |
5,196 |
72 |
| MANCHACA |
25 |
2 |
23 |
0 |
| MAXWELL |
57 |
9 |
47 |
1 |
| MOUNTAIN CITY |
42 |
3 |
39 |
1 |
| NIEDERWALD |
89 |
2 |
89 |
0 |
| SAN MARCOS |
5,906 |
142 |
5,674 |
90 |
| UHLAND |
30 |
1 |
29 |
0 |
| WIMBERLEY |
665 |
24 |
631 |
10 |
| WOODCREEK |
7 |
0 |
6 |
1 |
| TOTAL |
16,651 |
473
|
15,947
|
231
|
BY AGE AND GENDER
*Hays County Public Health updates the following information Monday – Friday only
| AGE RANGE |
FEMALE |
MALE |
TOTAL |
| 0-9 yrs. |
525 |
537 |
1,062 |
| 10-19 yrs. |
1,325 |
1,146 |
2,471 |
| 20-29 yrs. |
2,451 |
2,266 |
4,717 |
| 30-39 yrs. |
1,342 |
1,210 |
2,552 |
| 40-49 yrs. |
1,209 |
1,052 |
2,261 |
| 50-59 yrs. |
831 |
839 |
1,670 |
| 60-69 yrs. |
558 |
520 |
1,078 |
| 70-79 yrs. |
267 |
265 |
532 |
| > 80 yrs. |
189 |
119 |
308 |
| Total |
8,697 |
7,954 |
16,651 |
BY ETHNICITY AND GENDER
*Hays County Public Health updates the following information Monday – Friday only
| ETHNICITY |
FEMALE |
MALE |
TOTAL |
% OF CASES |
| HISPANIC |
4,300 |
3,882 |
8,182 |
49.1% |
| NON-HISPANIC |
2,944 |
2,730 |
5,674 |
34.1% |
| NOT-SPECIFIED |
1,453 |
1,342 |
2,795 |
16.8% |
| TOTAL |
8,697 |
7,954 |
16,651 |
100.0% |
BY RACE
*Hays County Public Health updates the following information Monday – Friday only
| RACE |
PERCENTAGE OF CASES |
| AMERICAN INDIAN |
0.1% |
| ASIAN |
1.0% |
| BLACK |
2.7% |
NATIVE HAWAIIAN
/ PACIFIC ISLANDER |
0% |
| WHITE |
69.6% |
| OTHER |
1.0% |
NOT SPECIFIED
/ UNKNOWN |
25.6% |
DEFINITIONS: CASE & CLINICAL CRITERIA
Confirmed: A case that is laboratory confirmed using a molecular diagnostic test (for example, PCR, Curative RCT-PCR, and Abbott ID Now RCT-PCR)
Probable: A case that:
› Using a method approved or authorized by the FDA or designated authority meets presumptive laboratory evidence of
- Detection of specific antigen (Ag) in a clinical specimen, OR
- Detection of a specific antibody in serum, plasma, or whole blood indicative of a new or recent infection
› AND meets clinical criteria
OR
› Meets vital records criteria (death certificate lists COVID-19 disease or SARS-CoV-2 as a cause of death or a significant condition contributing to death) with no confirmatory laboratory testing performed for COVID-19.
Clinical criteria:
› At least two of the following symptoms: fever (measured or subjective), chills, rigors, myalgia, headache, sore throat, new olfactory and taste disorder(s); OR
› At least one of the following symptoms: cough, shortness of breath, or difficulty breathing; OR
› Severe respiratory illness with at least one of the following:
- Clinical or radiographic evidence of pneumonia, or
- Acute respiratory distress syndrome (ARDS)
TEXAS & COVID-19: THE AFFECTS
NOTE: TEXAS CASE STATS & INFORMATION UPDATED THURSDAY, MARCH 11, AT 3:30 PM
*Texas testing data had not been updated by the time of publication*
TEXAS POPULATION: 29 MILLION
| STATE OF TEXAS |
MARCH 10, 2021 |
MARCH 11, 2021 |
COVID POSITIVE %
|
|
|
FATALITY %
|
|
|
| TOTAL TESTED (*provisionary) |
|
|
| TOTAL MOLECULAR TESTS (*runs a day behind) |
|
|
| TOTAL ANTIGEN TESTS (*runs a day behind) |
|
|
| TOTAL ANTIBODY TESTS (*runs a day behind) |
1,040,861 |
1,043,958 |
| TOTAL CONFIRMED CASES |
|
|
| NEW DAILY CASES (*provisionary) |
|
|
| ACTIVE (*provisionary) |
125,403 |
121,882 |
| NEW PROBABLE CASES |
|
|
| TOTAL PROBABLE CASES |
|
|
| TOTAL RECOVERED (*provisionary) |
|
|
| TOTAL RECOVERED OVER PAST 24 HOURS (*provisionary)18,957 |
7,928 |
7,638 |
| CURRENT HOSPITALIZATIONS (*provisionary) |
4,556 |
4,406
|
| TOTAL FATALITIES (*provisionary) |
|
|
| FATALITIES OVER PAST 24 HOURS (*provisionary) |
|
|
FEMALE % (updated on Friday’s)
|
33.5% |
33.5% |
MALE % (updated on Friday’s)
|
65.3% |
65.3% |
UNKNOWN % (Gender) (updated on Friday’s)
|
1.2% |
1.2% |
ASIAN % (updated on Friday’s)
|
1.2% |
1.2% |
BLACK % (updated on Friday’s)
|
16.7% |
16.7% |
HISPANIC % (updated on Friday’s)
|
36.6% |
36.6% |
OTHER % (updated on Friday’s)
|
0.6% |
0.6% |
WHITE % (updated on Friday’s)
|
33.8% |
33.8% |
UNKNOWN % (updated on Friday’s)
|
11.1% |
11.1% |
*NOTE: U.S. & INTERNATIONAL CASE COUNTS & STATS UPDATED ON THURSDAY, MARCH 11, AT 3:57 AM
U.S. CORONAVIRUS CASE OVERVIEW
*Disclaimer: This data is provisional and the situation changes rapidly and might not reflect some cases still being reported.
US POPULATION: 330 MILLION
| U.S. OVERVIEW
|
POSITIVE /
% RATE
|
FATALITIES /
% RATE
|
RECOVERED
|
ACTIVE
|
MARCH 11
(*provisionary) |
29,862,124 /
9.05% |
542,191 /
1.82% |
20,640,270 |
8,679,663 |
MARCH 10
(*provisionary) |
29,801,506 /
9.03% |
540,574 /
1.81%
|
20,549,678 |
8,711,254 |
Population Source: Census Bureau Population Clock
INTERNATIONAL CORONAVIRUS CASE OVERVIEW
*Disclaimer: This data is provisional and the situation changes rapidly and might not reflect some cases still being reported.
WORLD POPULATION: 7.7 BILLION
WORLDWIDE
OVERVIEW |
POSITIVE /
% RATE
|
FATALITIES /
% RATE |
RECOVERED |
ACTIVE |
MARCH 11
(*provisionary)
|
118,714,747 /
1.54% |
2,633,819 /
2.22% |
94,300,705 |
21,780,223 |
MARCH 10
(*provisionary)
|
118,209,329 /
1.54% |
2,623,409 /
2.22% |
93,897,579 |
21,688,341 |
Population Source: Census Bureau Population Clock

![]()
![]() .
.
![]()
![]()


