
Latest Review Of The Texas Economy
![]() The mining and logging industry ranked first in job creation followed by construction; professional and business services; leisure and hospitality; and transportation, warehousing, and utilities…
The mining and logging industry ranked first in job creation followed by construction; professional and business services; leisure and hospitality; and transportation, warehousing, and utilities…

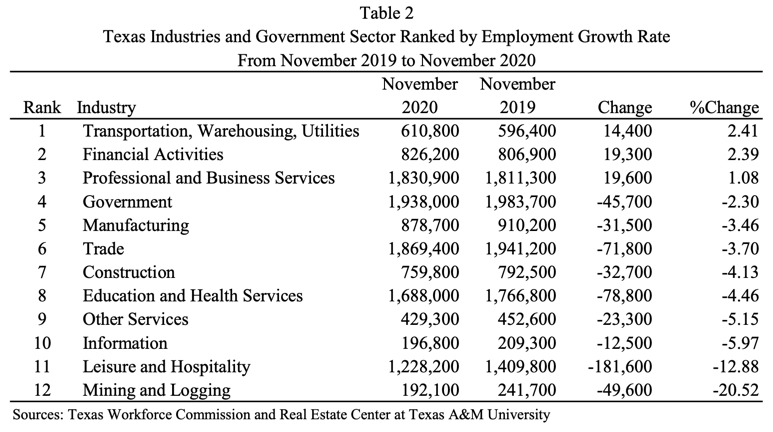
Texas Employment Growth Rates by Industry
Table 2 shows Texas industries ranked by employment growth rate from August 2017 to August 2018. All Texas industries except the information industry had more jobs in August 2018 than in August 2017.

The mining and logging industry ranked first in job creation followed by construction; professional and business services; leisure and hospitality; and transportation, warehousing, and utilities.
Figures 2 to 13 (shown in full report) show trends in employment growth rates by industry.
Texas Job Shares by Industry and the Government Sector
Table 3 shows Texas industries and the state’s government sector ranked by their shares of Texas jobs in August 2018.
Of the 12,626,500 nonagricultural jobs in August 2018, the highest percentage of employment by industry was in the trade industry followed by government sector, professional and business services, education and health services, leisure and hospitality, and manufacturing.
Since August 2017, professional and business services; leisure and hospitality; construction; transportation, warehousing, and utilities; and mining and logging have expanded their shares of Texas employment at the expense of the trade, government sector, education and health services, manufacturing, financial activities, other services, and the information industry.
Figures 14 to 25 (shown in full report) show trends in shares of total Texas jobs by industry.

Contributions to Texas Employment Growth Rate by Industry
Texas’ statewide employment growth rate of 3.2 percent, or more exactly 3.2251 percent, from August 2017 to August 2018 is the weighted average of employment growth rates for all Texas industries for the period.
Weights are shares of jobs by industry. The contribution of each industry to the statewide employment growth rate is equal to the employment growth rate of that industry multiplied by its share of Texas jobs. Table 4 shows Texas industries and the state’s government sector ranked by their contributions to Texas employment growth rates from August 2017 to August 2018.
The state’s professional and business services ranked first in contribution to job growth followed by construction, leisure and hospitality, trade, education and health services, mining and logging, and manufacturing.
Figures 26 to 37 (shown in full report) show trends in contributions of Texas industries to Texas job growth rates.

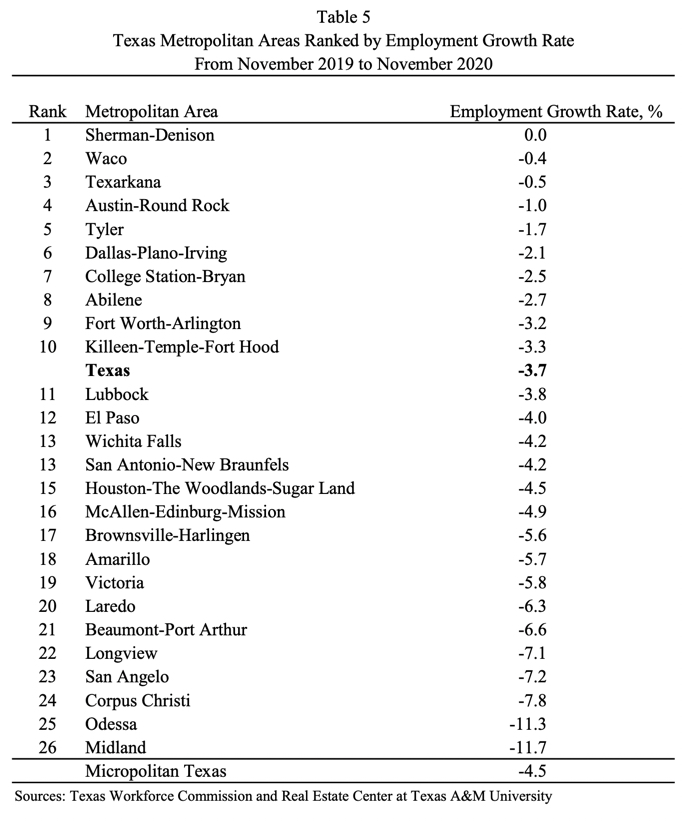
Employment Growth Rates by Texas Metropolitan Areas
All Texas metro areas except Victoria had more jobs in August 2018 than in August 2017 (Table 5). Midland ranked first in job creation followed by Tyler, Houston-The Woodlands-Sugar Land, Dallas-Plano-Irving, and Austin-Round Rock.
Figures 38 to 63 (shown in full report) show trends in annual employment growth rates for the state’s metropolitan areas.
Texas Job Shares by Metropolitan Area
Table 6 shows Texas metropolitan areas ranked by their shares of total Texas jobs in August 2018. Houston-The Woodlands-Sugar Land had the largest share of Texas jobs followed by Dallas-Plano-Irving, Austin-Round Rock, Fort Worth-Arlington, San Antonio-New Braunfels, El Paso, and McAllen-Edinburg-Mission.
Figures 64 to 89 (shown in full report) show trends in metropolitan shares of total Texas jobs.

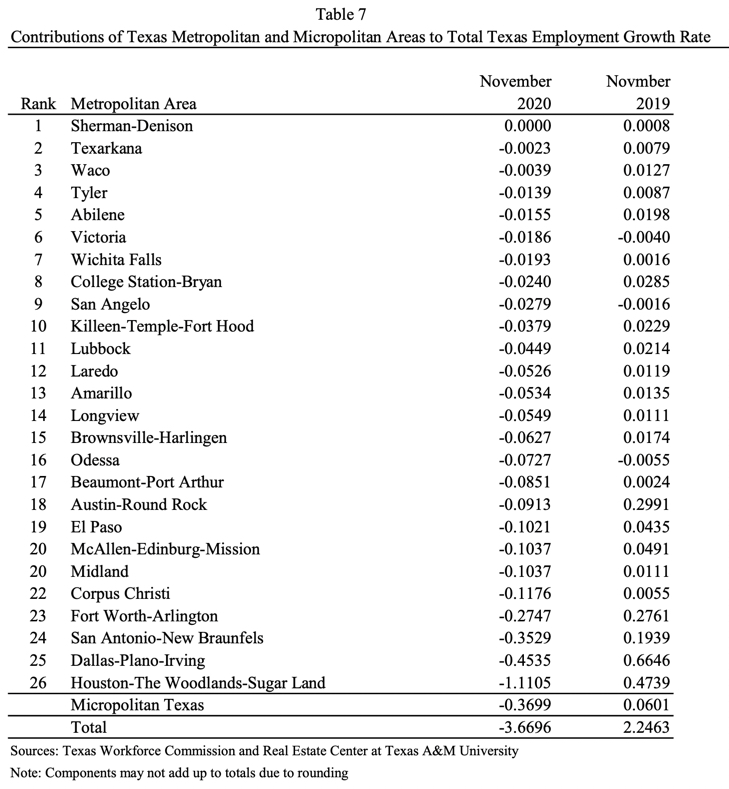
Contributions to Texas’ Employment Growth Rate by Metropolitan Area
The statewide employment growth rate of 3.2251 percent in Texas from August 2017 to August 2018 is the weighted average of employment growth rates of all Texas metros for the period. Weights are shares of jobs by area.
The contribution of each metro to the statewide employment growth rate is equal to the employment growth rate in that area multiplied by its share of Texas jobs. Table 7 shows Texas metros ranked by their contributions to Texas employment growth rates from August 2017 to August 2018.
Houston-The Woodlands-Sugar Land ranked first followed by Dallas-Plano-Irving, Austin-Round Rock, Fort Worth-Arlington, San Antonio-New Braunfels, Midland, El Paso, and McAllen-Edinburg-Mission.
Figures 90 to 115 (shown in full report) show trends in contributions of Texas metros to total Texas job growth rates.
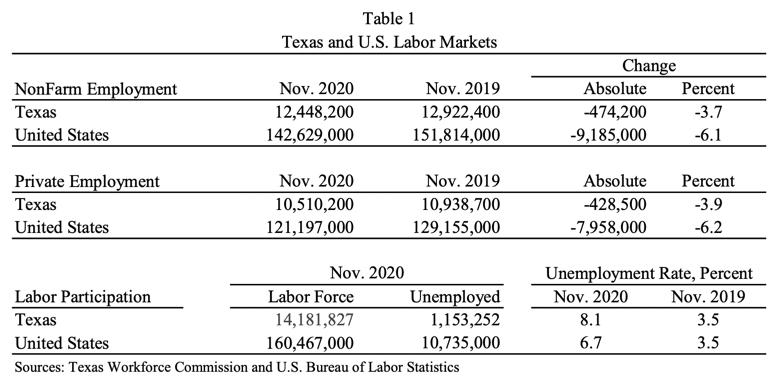
Unemployment Rate by Metropolitan Area
The state’s actual unemployment rate in August 2018 was 3.9 percent. Midland had the lowest unemployment rate followed by Amarillo, Odessa, Austin-Round Rock, Lubbock, Sherman-Denison, College Station-Bryan, and San Angelo (Table 8).

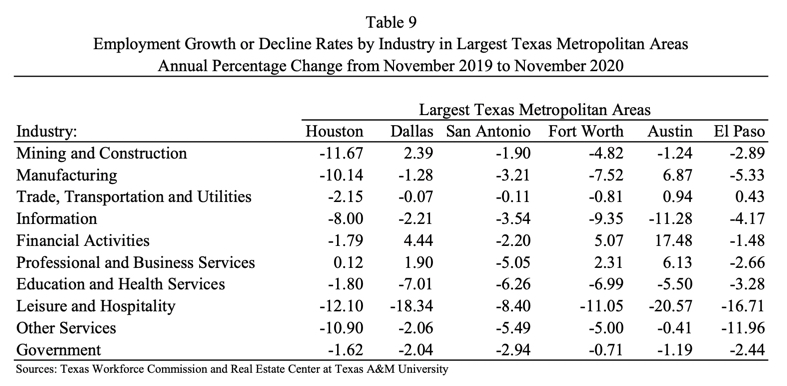
Employment Growth Rates by Industry in Largest Texas Metropolitan Areas
Table 9 shows annual growth rates of employment by industry in the six largest Texas metropolitan areas from August 2017 to August 2018. Houston-The Woodlands-Sugar Land’s economy is currently driven by mining and construction; professional and business services; manufacturing; trade, transportation, and utilities; and financial activities.
Dallas-Plano-Irving is currently experiencing positive employment growth rates in all industries as well as the government sector. San Antonio’s economy is currently driven by mining and construction, education and health services, and other services. Fort Worth-Arlington’s economy is currently experiencing job growth rates in all industries except information industry.
Austin is currently experiencing positive employment growth rates in all industries except manufacturing, education and health services, and the government sector. El Paso’s economy is currently driven by professional and business services, mining and construction, education and health services, leisure and hospitality, and financial activities.
Source: Real Estate Center of Texas, a publication of Texas A&M University.


