
Texas Housing Insight: May 2018 Summary
![]() Inventory levels showed signs of relief as new listings came to market, but structural supply issues persist. Homebuilders are grappling with increased land, labor, and lumber costs, as well as increased regulations…
Inventory levels showed signs of relief as new listings came to market, but structural supply issues persist. Homebuilders are grappling with increased land, labor, and lumber costs, as well as increased regulations…
Supply*
The Texas Residential Construction Cycle (Coincident) Index, which measures current construction activity, reached its highest level since 2008 as industry employment and construction values remained elevated. This momentum should continue through the summer months as the Texas Residential Construction Leading Index (RCLI) extended its upward climb despite increased interest rates and fewer multifamily housing starts.
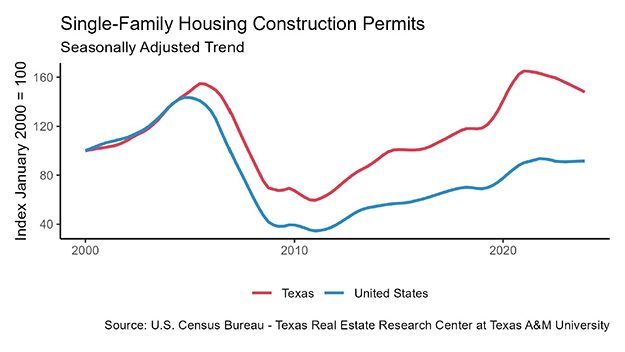
Single-family housing construction permits (unweighted) picked up 4.2 percent with 11,031 issued (non-seasonally adjusted) after stagnating the past three months.
Texas remained the national leader, accounting for 15 percent of permits issued across the country. Houston topped the national metropolitan rankings, issuing 3,794 permits, followed by Dallas-Fort Worth at 3,222.

At the metropolitan division level, permit activity cooled in Fort Worth-Arlington after Tarrant County surged to start the year. In the Dallas-Irving-Plano metropolitan division, upward momentum in Collin and Denton Counties more than offset declines in Dallas County. Austin held sixth place in the metropolitan ranking with 1,517 permits despite a 5 percent decline. The San Antonio MSA, which has 358,000 more residents than Austin, issued just 792 permits.
Rainy weather in May pulled total Texas housing starts back to 15,271 after spiking above a decade high last month. Homebuilders faced with rising material costs may also be delaying projects until later in the year when lumber prices are expected to dampen.
Single-family private construction values fell 5 percent, pulling year to date (YTD) growth into negative territory. Construction values dropped 9.1 and 15.8 percent YTD in DFW and San Antonio, respectively, followed by Austin at 3.1 percent.
Houston’s single-family construction values bounced back after a slight hiccup last month, bringing YTD growth into double digits (10.3 percent). Local developers may be accelerating activity ahead of stricter building regulations within the City of Houston set to take place later this year.
The Texas months of inventory (MOI) remained ultra-constrained but posted its third consecutive minor uptick to 3.6 months. Around six months of inventory is considered a balanced housing market. New MLS listings spiked this year, reaching record levels across the state and providing much needed relief to tight inventories.
Housing market imbalances, however, are far from over as structural supply-side changes are necessary given the steady sales pace. This month’s inventory improvements occurred primarily for homes priced above $300,000 where supply is more stable.
In the $200,000-$300,000 price range, the MOI inched above three months for the first time this year. For homes priced below $200,000, however, the MOI sank to an all-time low below 2.8 months.
The wave of new listings lifted the MOI across the Texas Urban Triangle. Fort Worth maintained the lowest MOI at 2.3 months but reached its highest point in over two years. Austin and Dallas hit YTD highs at 2.6 and 2.8 months, respectively, followed by San Antonio at 3.3 months.
Despite Houston’s heavy sales volume to start the year, the MOI reached four months for the first time since 2012. Outside of Houston, however, inventories remained historically low after pronounced multiyear shortages.
Demand
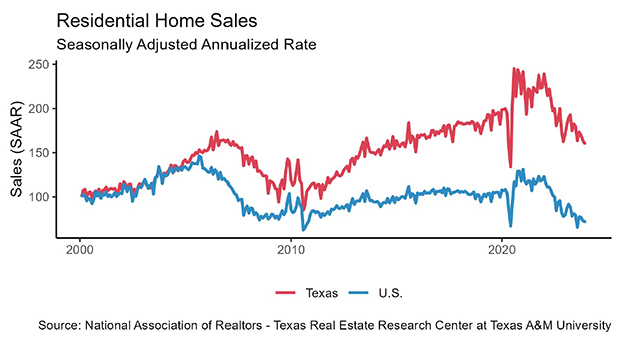
Housing sales ticked up half a percent amid gains in the resale market. Austin and Dallas posted their first monthly increase of the year at 1.6 and 3.2 percent, respectively, but continued to battle minimal supply. Fort Worth faced similar supply conditions but managed 0.5 percent sales growth. Sales volumes in these metros, however, remained in negative territory YTD.
In Houston, sales rose 2.3 percent YTD despite a monthly decline of half a percent. Fewer new-home transactions weighed on overall activity. Conditions could worsen as the market adjusts to new floodplain regulations that go into effect in September.
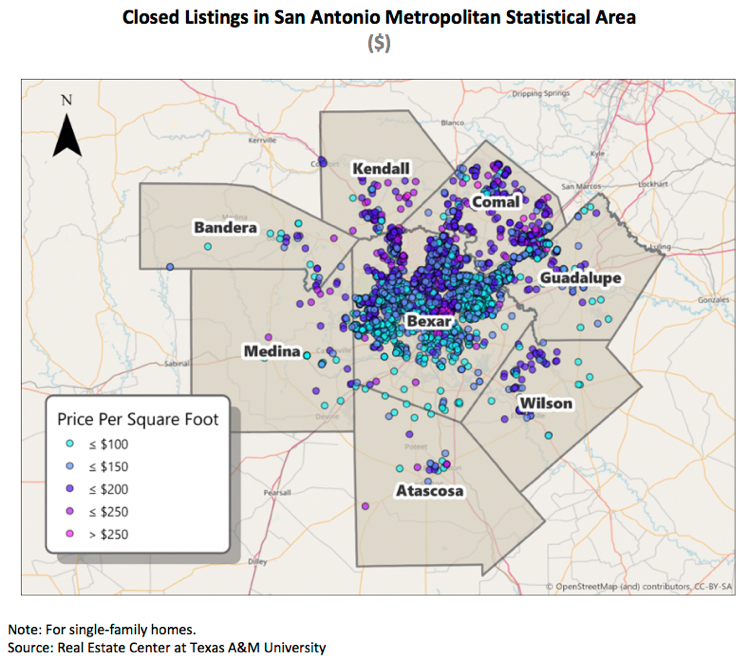
The housing boom expanded in San Antonio, reaching a record high 2,889 homes sold through an MLS this month as growth extended on the northern side of the MSA (see San Antonio map).
Texas’ healthy economy supported strong housing demand. The average days on market (DOM) balanced at its three-year trend of 58 days. Austin, Houston, and San Antonio faced similar demand conditions with DOM at 55, 56, and 57 days, respectively. The Dallas DOM flattened at 43 days after inching up over the past year. In Fort Worth, homes flew off the market at an average of just 36 days.
Statewide, homes priced from $200,000 to $300,000 averaged 52 days on the market and trended downward. Demand spilled into this price range as homebuyers struggled to find options priced below $200,000. This bottom price cohort (below $200,000) accounted for the largest proportion of sales through an MLS at 35 percent. In 2011, more than 72 percent of sales fell in this price range.
Robust economic data and rising inflation expectations lifted interest rates to multiyear highs. The ten-year U.S. Treasury bond yield jumped 11 basis points to 2.98 percent as investors’ confidence in the global economy outweighed trade concerns. The last time the ten-year yield surpassed 3 percent was in 2011.
The Federal Home Loan Mortgage Corporation’s 30-year fixed-rate posted a similar double-digit basis point increase to 4.59 percent. Despite remaining historically low, rising mortgage rates threaten to augment housing affordability issues, particularly for first-time buyers.
Prices
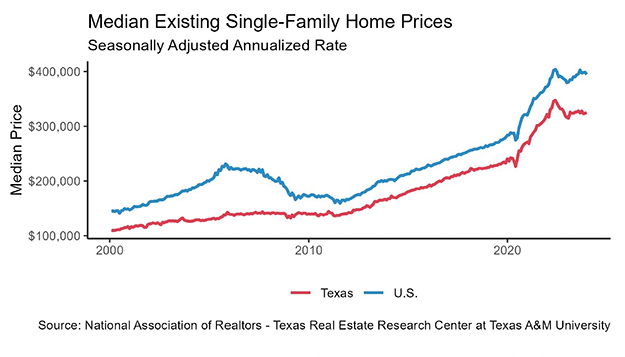
The uptick in supply eased housing price pressures. The Texas median home price balanced at $230,000 for the fifth consecutive month as home sizes shrunk. The median price fell below $278,000 in Dallas and hovered around $218,300 and $232,200 in San Antonio and Houston, respectively.
In Austin, the median price ticked up half a percent YTD to $305,967. Fort Worth’s median home price was unchanged at $232,000 but maintained 2.4 percent YTD growth.
The statewide median price per square foot (ppsf) rose for the 12th consecutive month to $115.35. Austin’s ppsf continued to soar above the other metros at $152.76. After reaching a record high last month, Houston’s ppsf dipped below $109 amid higher sales of large existing homes.
In North Texas, the premium paid for Dallas homes ($130.85 ppsf) relative to Fort Worth ($118.13 ppsf) fell below $13 per square foot and continued to converge as growth shifted west in the MSA. San Antonio’s sales boom and construction of smaller homes pushed its median ppsf up to a record $113.35.
________________
*All monthly measurements are calculated using seasonally adjusted data, and percentage changes are calculated month over month, unless stated otherwise.

This story originally published by Real Estate Center – Texas A&M University.


