

Austin Economic Indicators Show Much Slower Pace
By Judy Teng
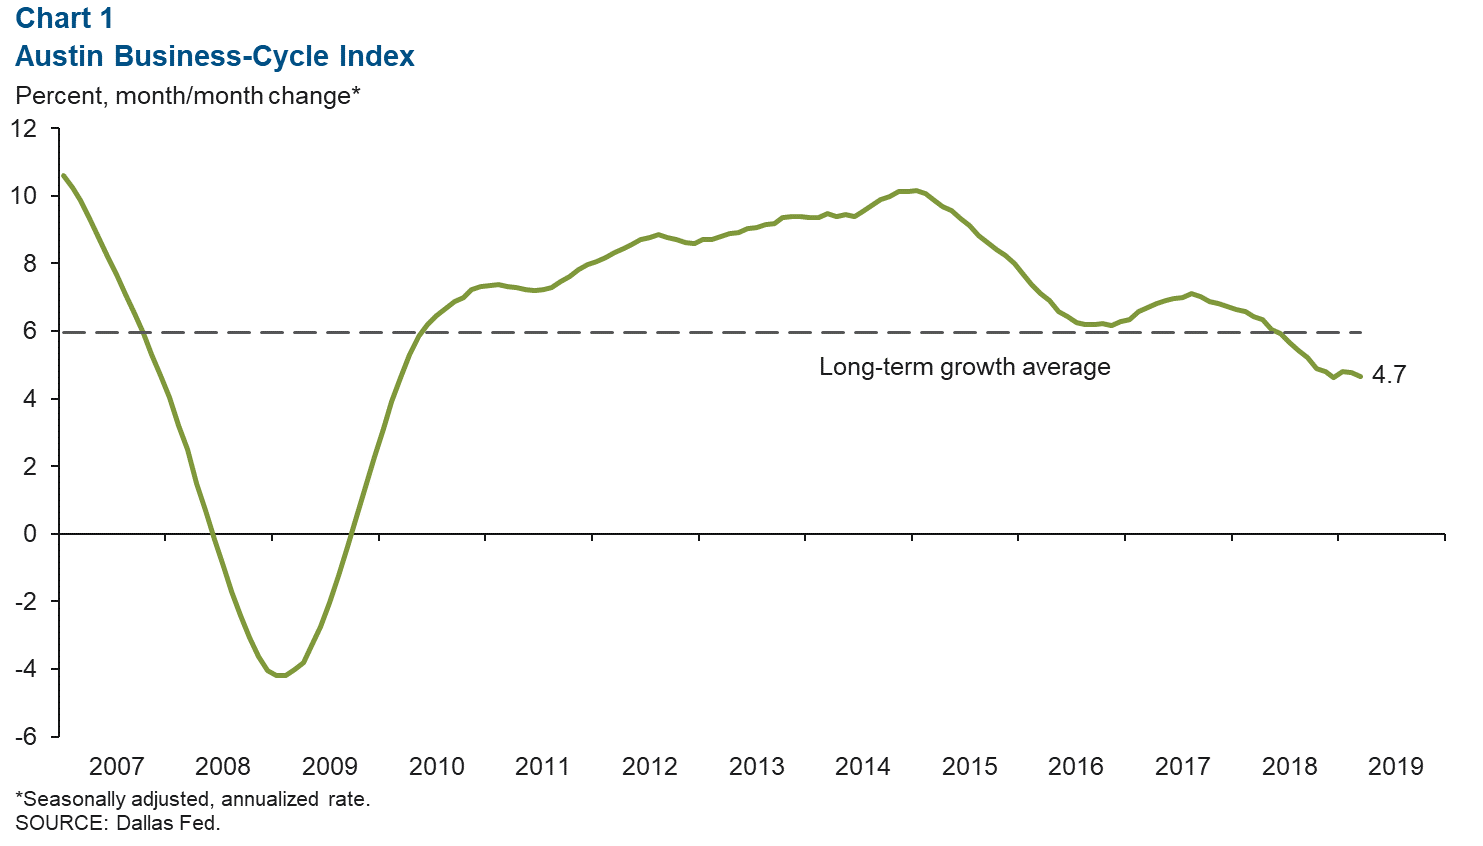
The Austin economy grew slowly in the first quarter. Growth in the Austin Business-Cycle Index decreased slightly and continued to run below its long-term trend.
Job growth was sluggish, with the construction and mining and financial activities sectors showing strength but manufacturing showing softness. Hourly wages ticked down in March, while home prices, sales and permits increased.
Business-Cycle Index
The Austin Business-Cycle Index decelerated to an annualized rate of 4.7 percent in March, making this the ninth consecutive month in which growth in the index was below its long-term average of 6 percent (Chart 1).
The unemployment rate declined, while March payrolls contracted.
Labor Market

Unemployment Rate Declines Further
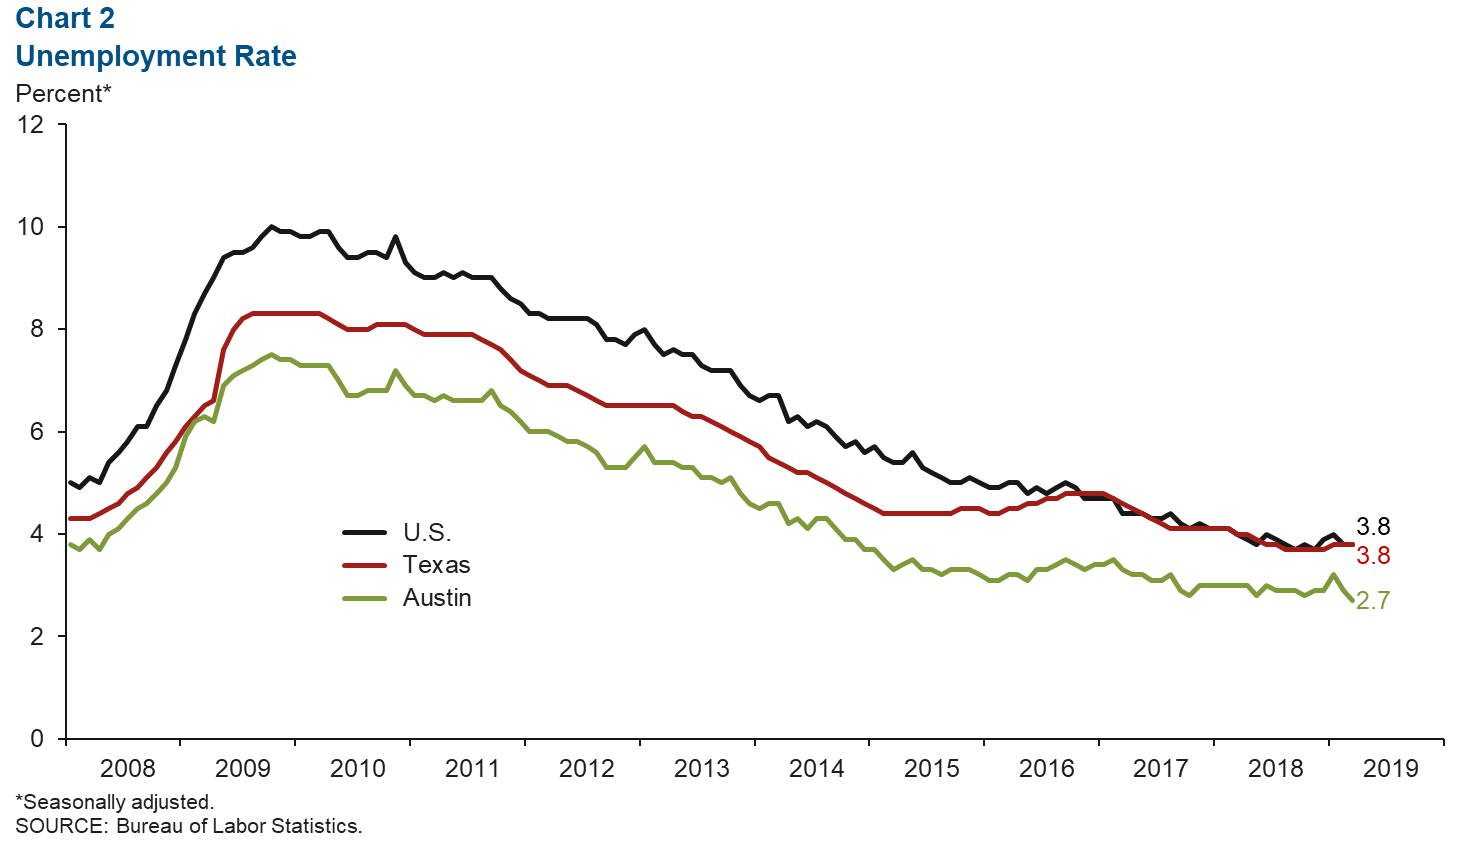
Austin’s unemployment rate declined from 2.9 percent to 2.7 percent in March, the lowest reading since December 2000. This is well below the Texas and U.S rates of 3.8 percent (Chart 2).
The metro’s labor force contracted at an annualized rate of 1.2 percent in March but is up 0.4 percent since December 2018.
Employment Growth Sluggish
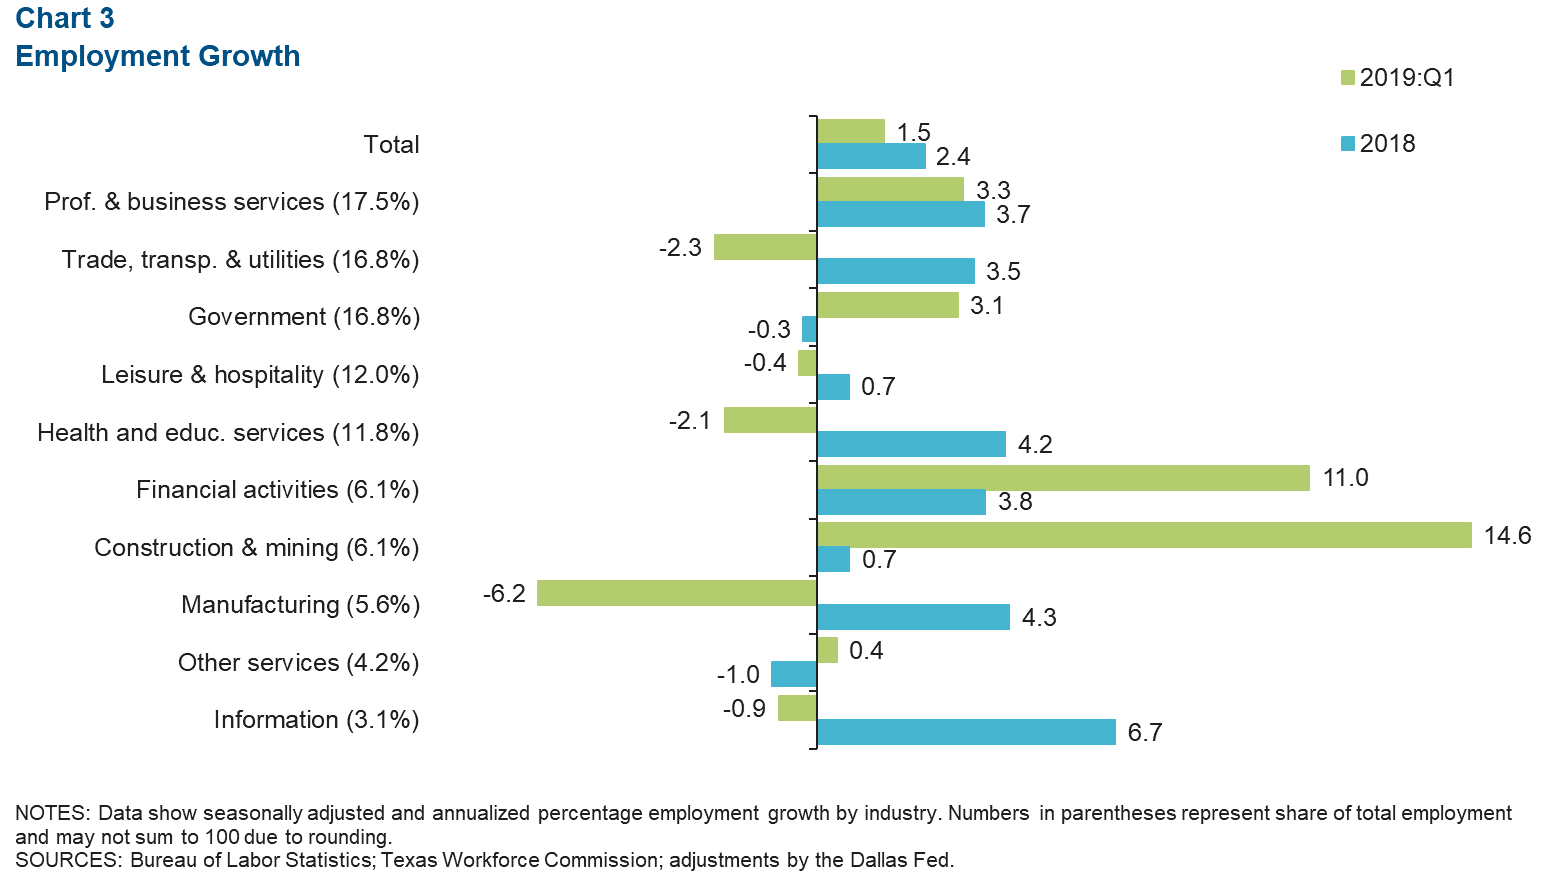
After expanding 2.4 percent in 2018, Austin job growth slowed to an annualized rate of 1.5 percent for the first quarter (Chart 3).
Growth was primarily focused within the construction and mining sector, which expanded at a robust annualized rate of 14.6 percent (a net 2,200 jobs).
The financial activities sector also saw strong growth at an annualized rate of 11 percent (1,700). The manufacturing sector contracted at an annualized rate of 6.2 percent, largely due to a decline in jobs related to computer and electronic products manufacturing.
The trade, transportation and utilities and health and education services sectors saw net losses of 1,050 and 670 jobs, respectively.
Hourly Wages Decline
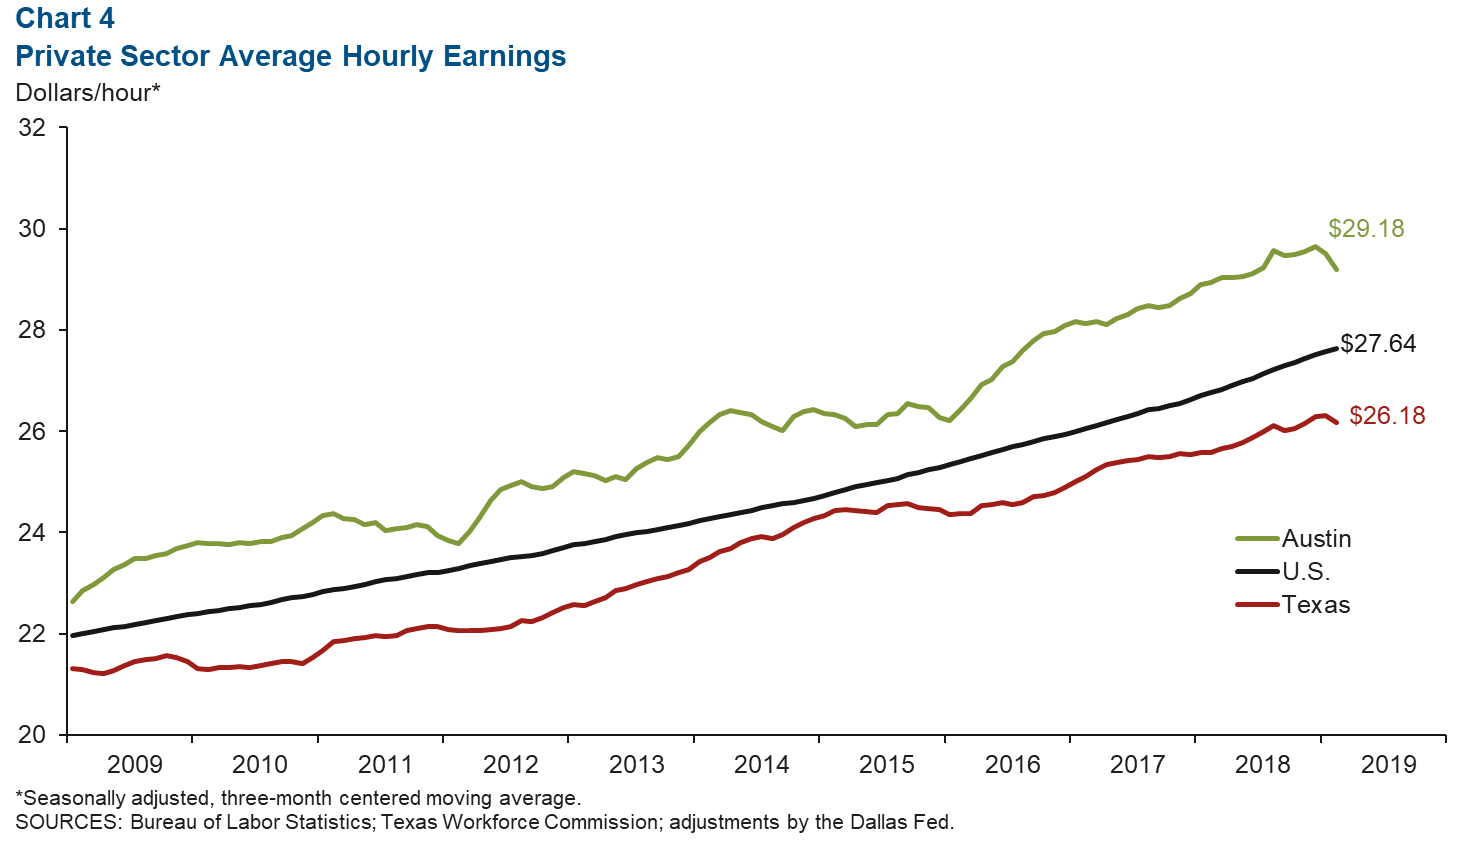
Austin’s three-month moving average for private sector hourly wages declined for a second consecutive month in March (Chart 4).
The metro’s average wage remained above the Texas and U.S. averages. Austin wages increased a slow 0.8 percent year over year, well below the nation’s 3.2 percent and state’s 2 percent increases.
Real Estate
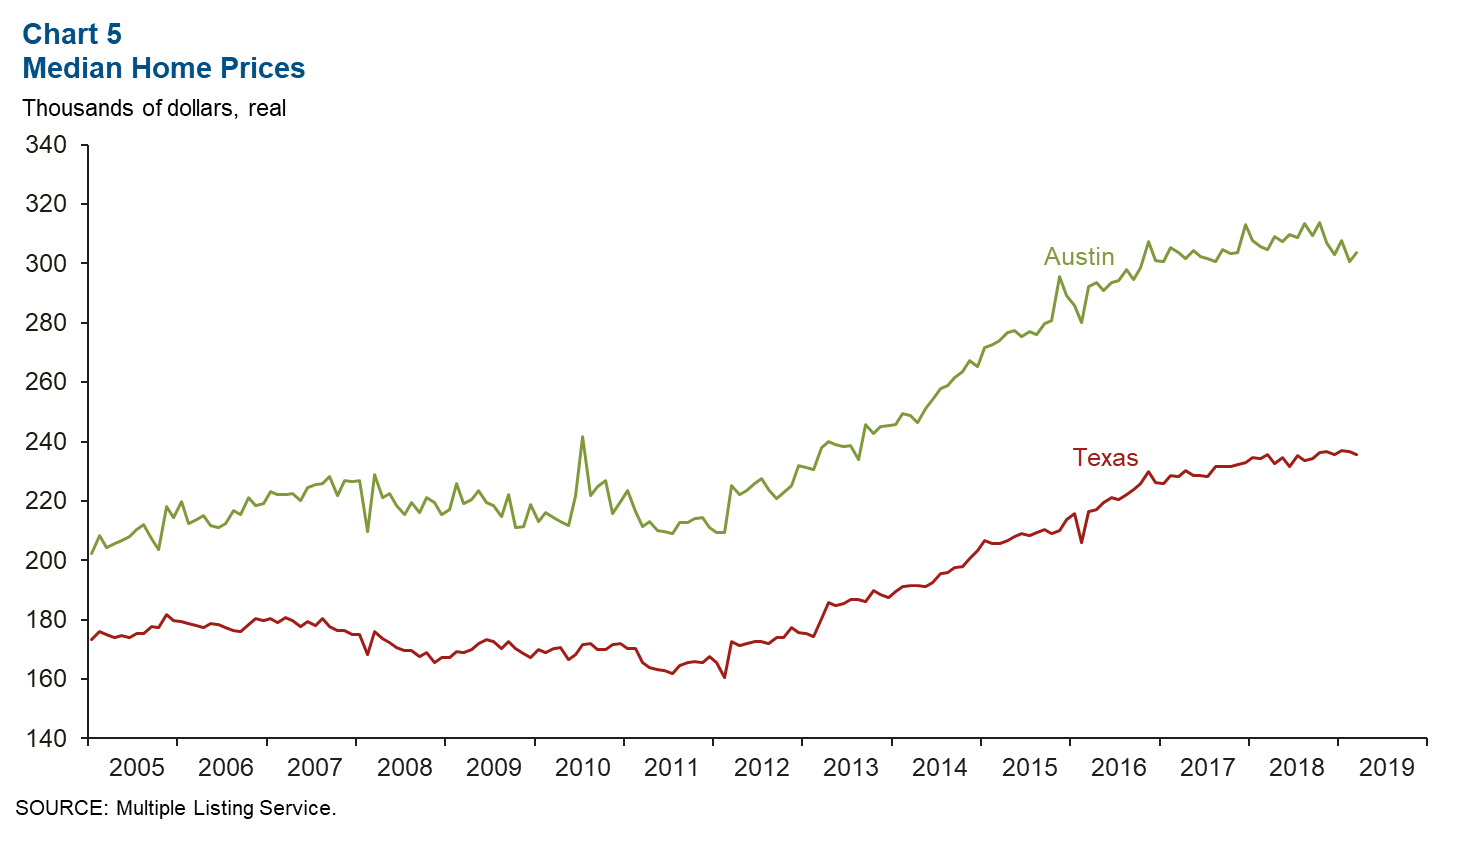
Sales Climb as Median Home Prices Soften
The median home price in Austin has weakened slightly in recent months, although it ticked up in March (Chart 5). The three-month centered moving average peaked in September 2018 at $312,243 and stood at $304,109 in February.
Sales volume increased from 8,601 units in the fourth quarter to 9,028 units in the first quarter. The median home price in the state increased to $236,475 in February, and home sales were up 3 percent quarter over quarter.
Inventory in the metro was at 2.6 months in March, well below the six months considered a balanced market.
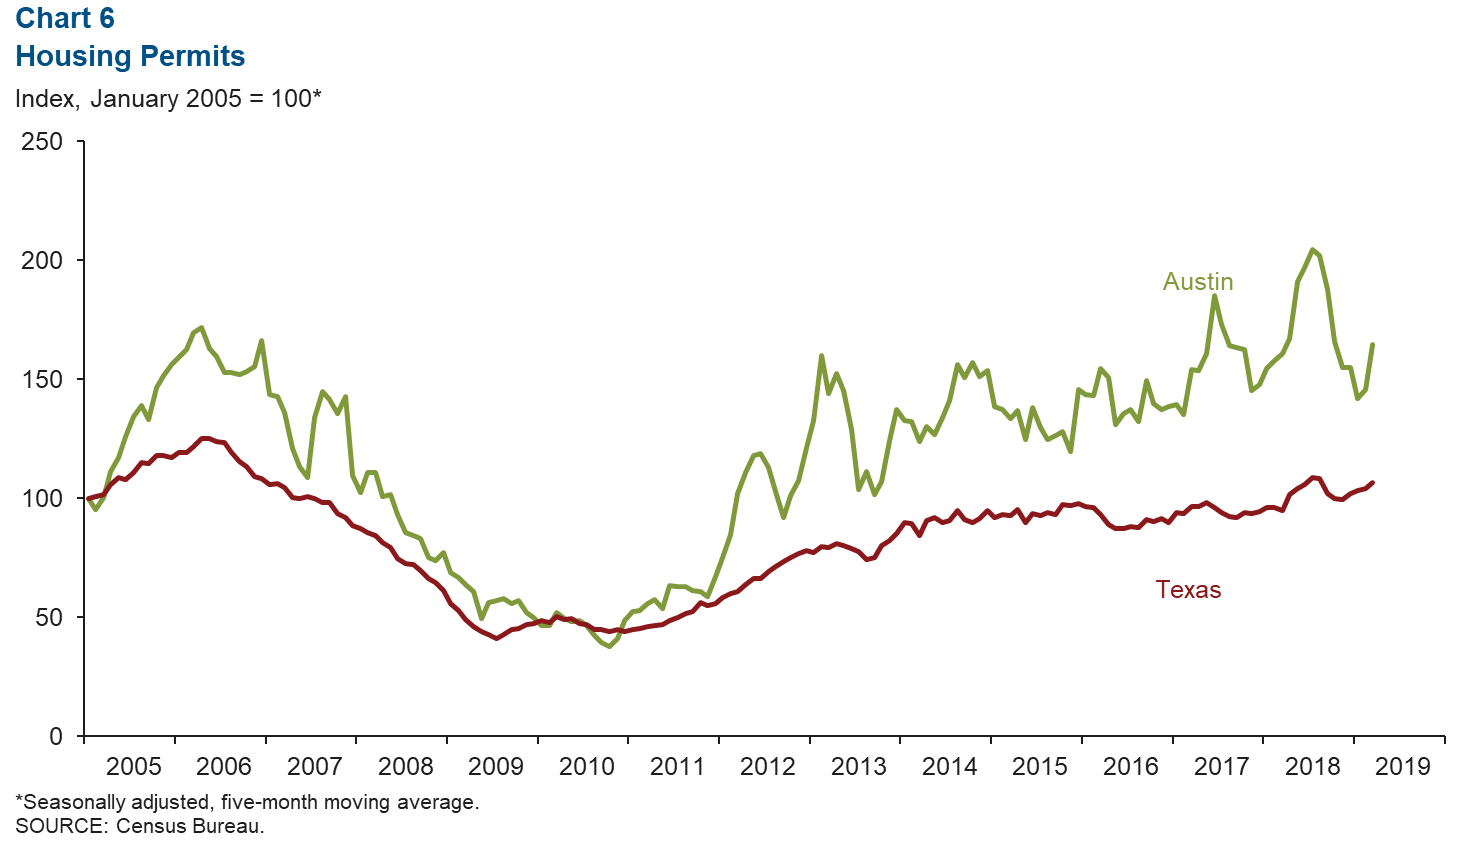
Construction Permits on the Rise
The five-month moving average for total Austin housing construction permits (single family and multifamily) increased 12.7 percent month over month in March (Chart 6).
This was well above the state’s 2.6 percent increase in construction permits. For 2018, permits in Austin increased 11.1 percent.
The average number of permits issued per month in the first quarter of 2019 was 9.2 percent lower than the average issued per month in 2018.
At the state level, the average permits issued per month in the first quarter was 1.4 percent lower than the average issued per month in 2018.
NOTE: Data may not match previously published numbers due to revisions.
Source: Federal Reserve Bank of Texas.Questions on Austin Economic Indicators can be addressed to Judy Teng at judy.teng@dal.frb.org.


