
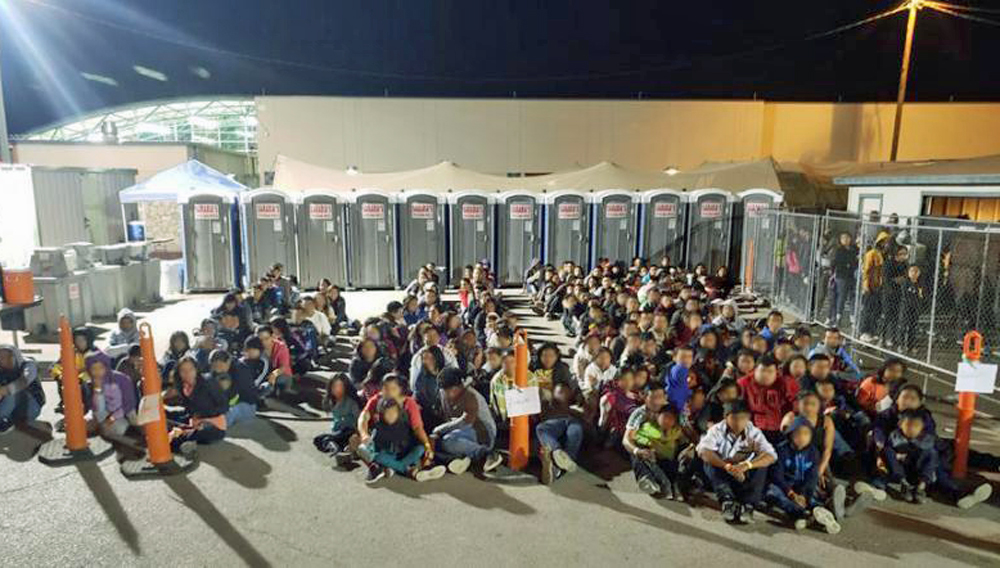
April 2019 Southern Border Stats Show Border Beyond ‘Breaking Point’
U.S. Customs and Border Protection is the nation’s largest federal law enforcement agency charged with securing the nation’s borders and facilitating international travel and trade. Their top priority is to keep terrorists and their weapons from entering the United States.
At the nation’s more than 300 ports of entry, CBP officers have a complex mission with broad law enforcement authorities tied to screening all foreign visitors, returning American citizens and imported cargo that enters the U.S.
Along the nation’s borders, the United States Border Patrol and Air and Marine Operations are the uniformed law enforcement arms of CBP responsible for securing U.S. borders between ports of entry.
The following is a summary of CBP enforcement actions related to inadmissibles, apprehensions, arrests of individuals with criminal convictions, individuals who have been apprehended multiple times crossing the border illegally, currancy and drug seizures.
Visit CBP’s Southwest Border Migration page for demographic information regarding apprehensions and inadmissibles on the southwest border and the Use of Force page for use-of-force statistics and case summaries.
“We are taking aggressive action to mitigate the crisis, and protect vulnerable people in our custody by expanding medical care, creating temporary facilities, improving transportation, using additional resources from across DHS while seeking continued support from interagency partners throughout the Federal government,” said Acting Secretary of Homeland Security Kevin McAleenan while recently visiting McAllen Texas.
BY SECTOR: Southwest Border Family Unit Subject, Unaccompanied Alien Children, and Single Adult Apprehensions Fiscal Year 2019 – By Month
| FMUA | UAC | SA | TOTAL | |
|---|---|---|---|---|
| Sector | FY 2019 APR | FY 2019 APR | FY 2019 APR | FY 2019 APR |
| Big Bend, Texas |
224 | 61 | 656 | 941 |
| Del Rio, Texas |
3,440 | 397 | 2,013 | 5,850 |
| El Centro | 737 | 257 | 2,397 | 3,391 |
| El Paso, Texas |
20,428 | 2,464 | 3,975 | 26,867 |
| Laredo, Texas |
101 | 259 | 3,612 | 3,972 |
| Rio Grande, Texas |
22,889 | 3,753 | 10,039 | 36,681 |
| San Diego, California |
2,096 | 370 | 3,725 | 6,191 |
| Tucson, Arizona |
1,538 | 395 | 3,988 | 5,921 |
| Yuma, Arizona |
7,021 | 941 | 1,201 | 9,163 |
| Southwest Border Total | 58,474 | 8,897 | 31,606 | 98,977 |
U.S. Border Patrol Southwest Border Apprehensions FY 2019

| USBP | Demographic | OCT | NOV | DEC | JAN | FEB | MAR | APR | Total |
|---|---|---|---|---|---|---|---|---|---|
| Southwest Border | Unaccompanied Alien Child | 4,968 | 5,259 | 4,754 | 5,107 | 6,821 | 8,973 | 8,897 | 44,779 |
| Family Units* | 23,116 | 25,164 | 27,507 | 24,200 | 36,531 | 53,205 | 58,474 | 248,197 | |
| Single Adult | 22,924 | 21,433 | 18,487 | 18,684 | 23,531 | 30,653 | 31,606 | 167,318 | |
| Southwest Border Total Apprehensions | 51,008 | 51,856 | 50,748 | 47,991 | 66,883 | 92,831 | 98,977 | 460,294 | |
*Family Unit represents the number of individuals (either a child under 18 years old, parent, or legal guardian) apprehended with a family member by the U.S. Border Patrol.
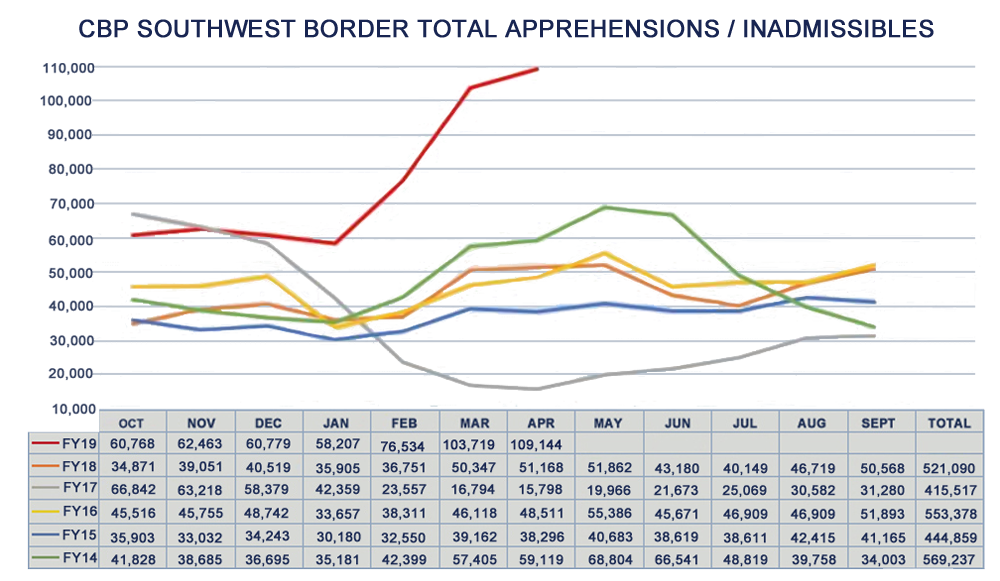
In April, 98,977 people were apprehended between ports of entry on the Southwest Border, compared with 92,831 in the month of March and 66,883 in February.
In FY18, a total of 396,579 individuals were apprehended between ports of entry on our Southwest Border.
Office of Field Operations Southwest Border Inadmissibles FY 2019
| Field Operations | Demographic | OCT | NOV | DEC | JAN | FEB | MAR | APR | Total |
|---|---|---|---|---|---|---|---|---|---|
| Southwest Border | Unaccompanied Alien Child | 453 | 404 | 350 | 408 | 426 | 423 | 386 | 2,850 |
| Family Units* | 4,178 | 4,986 | 4,382 | 4,211 | 4,210 | 4,196 | 3,443 | 29,606 | |
| Single Adults | 5,053 | 5,146 | 5,213 | 5,619 | 4,939 | 6,168 | 6,144 | 38,282 | |
| Accompanied Minor Child** | 86 | 70 | 81 | 71 | 76 | 101 | 194 | 679 | |
| Southwest Border Total Inadmissibles | 9,770 | 10,606 | 10,026 | 10,309 | 9,651 | 10,888 | 10,167 | 71,417 | |
*Family Unit represents the number of individuals (either a child under 18 years old, parent, or legal guardian) deemed inadmissible with a family member by the Office of Field Operations.
**Accompanied Minor Child represents a child accompanied by a parent or legal guardian and the parent or legal guardian is either a U.S. Citizen, Lawful Permanent Resident, or admissible alien, and the child is determined to be inadmissible.
In April, 10,167 people presenting themselves at ports of entry on the Southwest Border were deemed inadmissible, compared with 10,888 in the month of March and 9,651 in February.
In FY18, 124,511 people presenting themselves at ports of entry on the Southwest Border were deemed inadmissible.
OFO inadmissibility metrics include: individuals encountered at ports of entry who are seeking lawful admission into the United States but are determined to be inadmissible, individuals presenting themselves to seek humanitarian protection under our laws, and individuals who withdraw an application for admission and return to their countries of origin within a short timeframe.
For breakdown by Field Office, visit Southwest Border Inadmissibles by Field Office.
Arrests of Individuals with Criminal Convictions
or Those Wanted by Law Enforcement
Numbers below reflect FY 2017-2018 totals, FY 2019 TD (to date) (October 1, 2018 – April 30, 2019)
| FY17 | FY18 | FY19TD | |
|---|---|---|---|
| OFFICE OF FIELD OPERATIONS | |||
| Criminal Aliens3 Encountered | 10,596 | 13,788 | 7,241 |
| NCIC4 Arrests | 7,656 | 5,889 | 1,195 |
| U.S. BORDER PATROL | |||
| Criminal Aliens3 Encountered | 8,531 | 6,698 | 2,932 |
| Criminal Aliens with Outstanding Wants or Warrants | 2,675 | 1,550 | 2,405 |
3Criminal Aliens refers to aliens who have been convicted of crime, whether in the United States or abroad, so long as the conviction is for conduct which is deemed criminal by the United States. Criminal aliens encountered at ports of entry are inadmissible, absent extenuating circumstances, and represent a subset of total OFO inadmissibles. U.S. Border Patrol arrests of criminal aliens are a subset of total apprehensions. See U.S. Border Patrol Criminal Alien Statistics for a breakdown of criminal alien stats by type of conviction.
4NCIC (National Crime Information Center) arrests refers to the number of CBP arrests of individuals, including U.S. citizens, who are wanted by other law enforcement agencies.
Currency Seizures
Numbers below reflect FY 2015-2018 totals, FY 2019 TD (to date) (October 1, 2018 – April 30, 2019)
| FY15 | FY16 | FY17 | FY18 | FY19TD | |
|---|---|---|---|---|---|
| Amount (USD) | $75,964,824 | $62,101,328 | $65,002,856 | $64,741,939 | $46,598,214 |
Monthly Office of Field Operations Currency Seizures
Numbers below reflect FY 2015-2018 totals, FY 2019 TD (to date) (October 1, 2018 – April 30, 2019)
| FY 18 | FY 19 | |
|---|---|---|
| October | $35,829 | $4,190,389 |
| November | $26,285 | $4,3460,341 |
| December | $2,822 | $4,428,486 |
| January | $203,213 | $7,825,634 |
| February | $117,933 | $5,575,463 |
| March | $157,669 | $6,518,165 |
| April | $17,913 | 13,699,736 |
| May | $256,033 | |
| June | $31,494 | |
| July | $14,339 | |
| August | $169,592 | |
| September | $80,358 | |
| Total | $1,113,480 | $46,598,214 |
U.S. Border Patrol Currency Seizures (October 1, 2018 to April 30, 2019)
| FY 15 | FY 16 | FY 17 | FY 18 | FY 19 TD | |
|---|---|---|---|---|---|
| Amount (USD) | $4,741,288 | $7,924,537 | $5,869,004 | $7,176,142 | $2,288,504 |
Monthly U.S. Border Patrol Nationwide Checkpoint Currency Seizures
Numbers below reflect FY 2015-2018 totals, FY 2019 TD (to date) (October 1, 2018 – April 30, 2019)
| FY 18 | FY 19 | |
|---|---|---|
| October | $35,829 | $49,247 |
| November | $26,285 | $51,269 |
| December | $2,822 | $63,697 |
| January | $203,213 | $59,857 |
| February | $117,933 | $103,982 |
| March | $157,669 | $110,924 |
| April | $17,913 | $15,016 |
| May | $256,033 | |
| June | $31,494 | |
| July | $14,339 | |
| August | $169,592 | |
| September | $80,358 | |
| Total | $1,113,480 | $453,992 |
For a breakdown by Sector, visit the USBP Currency Seizures by Sector webpage.
Drug Seizures
Numbers below reflect FY 2014-2018 totals, FY 2019 TD (to date) (October 1, 2018 – April 30, 2019)
| FY 14 | FY 15 | FY 16 | FY 17 | FY 18 | FY 19 TD | |
|---|---|---|---|---|---|---|
| Cocaine | 45,323 | 38,346 | 52,838 | 62,415 | 51,713 | 32,951 |
| Heroin | 4,356 | 6,023 | 4,224 | 3,398 | 5,205 | 2,708 |
| Marijuana | 438,146 | 602,821 | 516,122 | 366,627 | 300,289 | 138,610 |
| Methamphetamine | 19,613 | 25,495 | 33,086 | 46,247 | 56,362 | 32,814 |
| Fentanyl | n/a | 70 | 596 | 1,875 | 1,785 | 1,207 |
*weights are in pounds (lb)
Monthly Office of Field Operations Drug Seizures (October 1, 2018 to April 30, 2019)
| Cocaine | Heroin | Marijuana | Methamphetamine | Fentanyl | Other | |
|---|---|---|---|---|---|---|
| October | 3,165 | 469 | 8,808 | 3,756 | 133 | 26,379 |
| November | 4,143 | 334 | 29,828 | 3,691 | 11 | 23,100 |
| December | 6,733 | 321 | 24,474 | 3,486 | 44 | 8,398 |
| January | 2,407 | 273 | 11,324 | 4,405 | 336 | 13,173 |
| February | 9,218 | 320 | 21,636 | 5,509 | 120 | 18,328 |
| March | 5,872 | 493 | 25,506 | 6,057 | 244 | 7,981 |
| April | 1,413 | 499 | 17,035 | 5,910 | 221 | 14,796 |
*weights are in pounds (lb)
U.S. Border Patrol Drug Seizures (October 1, 2018 to April 30, 2019)
| FY 14 | FY 15 | FY 16 | FY 17 | FY 18 | FY 19 TD | |
|---|---|---|---|---|---|---|
| Cocaine | 4,554 | 11,220 | 5,473 | 9,346 | 6,550 | 9,236 |
| Heroin | 606 | 518 | 566 | 953 | 568 | 385 |
| Marijuana | 1,922,545 | 1,538,307 | 1,294,052 | 861,231 | 461,030 | 171,082 |
| Methamphetamine | 3,930 | 6,443 | 8,224 | 10,328 | 11,314 | 6,183 |
| Fentanyl | n/a | n/a | 105 | 181 | 388 | 136 |
*weights are in pounds (lb)
Monthly U.S. Border Patrol Nationwide Checkpoint Drug Seizures
(October 1, 2018 to April 30, 2019)
| Cocaine | Heroin | Marijuana | Methamphetamine | Fentanyl | Other | |
|---|---|---|---|---|---|---|
| October | 121 | 1 | 1,546 | 600 | 0 | 4 |
| November | 48 | 15 | 1,180 | 473 | 15 | 5 |
| December | 140 | 5 | 2,460 | 258 | 0 | 422 |
| January | 259 | 3 | 2,802 | 542 | 16 | 5 |
| February | 197 | 44 | 3,929 | 646 | 20 | 52 |
| March | 87 | 2 | 2,197 | 337 | 1 | 13 |
| April | 368 | 134 | 1,758 | 349 | 19 | 4 |
*weights are in pounds (lb)
Gang Affiliated Enforcement
U.S. Border Patrol Nationwide Apprehensions by Gang Affiliation
Numbers below reflect FY2015-2018 totals, FY 2019 TD (to date) (October 1, 2018 – April 30, 2019)
| Gang Affiliation | FY15 | FY16 | FY17 | FY18 | FY19TD |
| 107th St | 0 | 0 | 0 | 1 | 0 |
|---|---|---|---|---|---|
| 18th Street | 84 | 47 | 61 | 145 | 97 |
| Angelino Heights Sureno 13 | 0 | 0 | 1 | 0 | 0 |
| Bandidos | 0 | 4 | 0 | 0 | 0 |
| Barrio Azteca | 6 | 0 | 3 | 4 | 0 |
| Border Brothers | 0 | 0 | 0 | 1 | 1 |
| Brown Pride | 0 | 0 | 0 | 0 | 0 |
| Chirizos | 0 | 0 | 0 | 1 | 0 |
| Folk Nation | 0 | 1 | 0 | 0 | 0 |
| Hard Times 13 | 0 | 1 | 0 | 0 | 0 |
| Hells Angels | 0 | 0 | 0 | 0 | 1 |
| Hermanos Pistoleros Latinos (HPL) | 2 | 18 | 3 | 2 | 1 |
| Latin Kings | 16 | 0 | 6 | 7 | 15 |
| Locos Surenos Trece | 0 | 1 | 0 | 1 | 0 |
| Los Traviosos | 0 | 0 | 0 | 0 | 1 |
| Los Zetas | 0 | 253 | 0 | 0 | 0 |
| MS-13 | 335 | 0 | 228 | 413 | 267 |
| Mara 18 | 0 | 0 | 0 | 1 | 1 |
| Mara-R | 0 | 0 | 1 | 1 | 0 |
| Market Street | 0 | 0 | 0 | 0 | 1 |
| Maravilla Salva Trucha | 0 | 1 | 0 | 2 | 0 |
| Mexican Mafia | 4 | 6 | 4 | 3 | 6 |
| Mexicles | 0 | 0 | 0 | 0 | 0 |
| Mexikanemi | 2 | 0 | 3 | 0 | 0 |
| Nortenos | 14 | 5 | 6 | 5 | 5 |
| Other | 154 | 136 | 90 | 82 | 64 |
| Outlaws | 0 | 0 | 0 | 0 | 0 |
| Paisas | 73 | 119 | 53 | 62 | 60 |
| Partido Revolucionario Mexican (PRM) | 0 | 0 | 0 | 0 | 1 |
| Playboys | 0 | 1 | 0 | 0 | 0 |
| South Los Angeles | 0 | 0 | 0 | 1 | 0 |
| Surenos (sur-13) | 140 | 90 | 66 | 66 | 51 |
| Tango Blast | 14 | 16 | 8 | 8 | 14 |
| Texas Syndicate | 0 | 3 | 1 | 1 | 2 |
| Vallucos | 0 | 0 | 0 | 0 | 1 |
| Vilanos-13 | 0 | 0 | 0 | 1 | 0 |
| West Park | 0 | 0 | 1 | 0 | 0 |
| Zetas | 0 | 0 | 1 | 1 | 0 |
| Total | 844 | 702 | 536 | 808 | 589 |
U.S. Border Patrol Recidivism Rates
| FY 14 | FY 15 | FY 16 | FY 17 | FY 18 | |
|---|---|---|---|---|---|
| Recidivism5 | 14% | 14% | 12% | 10% | 11% |
5Recidivism refers to percentage of individuals apprehended more than one time by the Border Patrol within a fiscal year.
Previous Year Enforcement Statistics Fiscal Year 2018
Southwest Border Unaccompanied Alien
Children Inadmissibles by Fiscal Year
Numbers below reflect Fiscal Years 2017 – 2018 and 2019 TD
| Unaccompanied Alien Children by Country | |||
|---|---|---|---|
| Country | FY 2017 | FY 2018 | FY 19TD APR |
| El Salvador | 1,721 | 833 | 99 |
| Guatemala | 2,829 | 3,691 | 560 |
| Honduras | 1,173 | 1,655 | 443 |
| Mexico | 1,556 | 2,210 | 1,550 |
Southwest Border Family Unit* Inadmissibles by Fiscal Year
Numbers below reflect Fiscal Years 2017 – 2018 and 2019 TD
| Family Unit by Country | |||
|---|---|---|---|
| Country | FY 2017 | FY 2018 | FY 19TD APR |
| El Salvador | 4,577 | 3,738 | 1,131 |
| Guatemala | 6,789 | 12,185 | 3,833 |
| Honduras | 4,246 | 8,327 | 3,779 |
| Mexico | 10,628 | 21,411 | 13,847 |
*Family Unit represents the number of individuals (either a child under 18 years old, parent or legal guardian) deemed inadmissible with a family member by the Office of Field Operations.
Southwest Border Accompanied Minor Child* by Fiscal Year
Numbers below reflect Fiscal Years 2017 – 2018 and 2019 TD
| Accompanied Minor Children by Country | |||
|---|---|---|---|
| Country | FY 2017 | FY 2018 | FY 19TD APR |
| El Salvador | 24 | 14 | 7 |
| Guatemala | 46 | 85 | 25 |
| Honduras | 34 | 58 | 45 |
| Mexico | 940 | 1,184 | 557 |
*Accompanied Minor Child represents a child accompanied by a parent or legal guardian and the parent or legal guardian is either a U.S. Citizen, Lawful Permanent Resident or admissible alien, and the child is determined to be inadmissible.
Southwest Border Single Adult Inadmissibles by Fiscal Year
Numbers below reflect Fiscal Years 2017 – 2018 and 2019 TD
| Single Adults by Country | |||
|---|---|---|---|
| Country | FY 2017 | FY 2018 | FY 19TD APR |
| El Salvador | 1,020 | 1,088 | 679 |
| Guatemala | 1,100 | 1,648 | 670 |
| Honduras | 917 | 1,719 | 1,514 |
| Mexico | 41,044 | 45,525 | 21,847 |
Cuban Inadmissibles
U.S. Customs and Border Protection maintains a robust posture regarding the enforcement of our immigration laws along the nation’s borders and coastal areas.
*Effective January 12, 2017, the United States ended the special parole policy, also known as the “wet-foot/dry-foot” policy, for Cuban migrants that has been in place since the mid-1990s.
Since then, Cuban nationals who attempt to illegally enter the United States are subject to removal, consistent with our enforcement priorities.
These actions are part of the ongoing normalization of relations between the governments of the United States and Cuba, and reflect a commitment to have a broader immigration policy in which we treat people from different countries consistently.
Numbers below reflect totals for Fiscal Years 2014-2018, and 2019 TD
| Cuban Inadmissibles | ||||||
|---|---|---|---|---|---|---|
| Field Office | FY 2014 | FY 2015 | FY 2016 | FY 2017 | FY 2018 | FY 19TD APR |
| El Paso | 415 | 685 | 5,018 | 340 | 394 | 4,737 |
| Laredo | 15,333 | 26,181 | 34,658 | 14,275 | 6,533 | 5,835 |
| San Diego | 1,229 | 1,555 | 1,589 | 600 | 131 | 188 |
| Tucson | 132 | 221 | 258 | 168 | 21 | 150 |
| Southwest Border Totals | 17,109 | 28,642 | 41,523 | 15,383 | 7,079 | 10,910 |
Haitian Inadmissibles
Numbers below reflect totals for Fiscal Years 2014-2018, and 2019 TD
| Haitian Inadmissibles | ||||||
|---|---|---|---|---|---|---|
| Field Office | FY 2014 | FY 2015 | FY 2016 | FY 2017 | FY 2018 | FY 19TD APR |
| El Paso | 1 | 0 | 2 | 18 | 0 | 0 |
| Laredo | 6 | 1 | 6 | 160 | 2 | 1 |
| San Diego | 477 | 333 | 6,377 | 8,057 | 294 | 664 |
| Tucson | 0 | 0 | 39 | 960 | 1 | 0 |
| Southwest Border Totals | 484 | 334 | 6,424 | 9,195 | 297 | 665 |
Southwest Border Inadmissibles Fiscal Year 2019 – By Month
| FMUA | UAC | AMC | SA | TOTAL | |
|---|---|---|---|---|---|
| Field Offices | FY 2019 OCT | FY 2019 OCT | FY 2019 OCT | FY 2019 OCT | FY 2019 OCT |
| El Paso | 835 | 84 | 4 | 580 | 1,503 |
| Laredo | 1,179 | 71 | 67 | 2,370 | 3,687 |
| San Diego | 1,303 | 180 | 5 | 1,645 | 3,133 |
| Tucson | 861 | 118 | 10 | 458 | 1,447 |
| Total | 4,178 | 453 | 86 | 5,053 | 9,770 |
Cuban and Haitian Inadmissibles*
| Cubans | Haitians | |
|---|---|---|
| Field Offices | FY 2019 OCT | FY 2019 OCT |
| El Paso | 166 | 0 |
| Laredo | 795 | 0 |
| San Diego | 35 | 37 |
| Tucson | 19 | 0 |
| Total | 1,015 | 37 |
*Note: Cuban and Haitian inadmissibles are a subset of the total Southwest Border inadmissibles data above.


