Staff Reports
EDITORIAL NOTE
According to the CDC, the State of Texas and Hays County Public Health all give the same disclaimer on all current counts and totals. “The Coronavirus (COVID-19) is a very fluid situation, and it will continue to be. All case numbers and totals are subject to change. As new information becomes available, we will publish those updates.”
According to the Texas Department of State Health Services (DSHS), Texas received 676,280 COVID-19 vaccines, and Hays County received 4,680 weekly vaccine allocations.
On Saturday, DSHS reported that Hays County had vaccinated 24,385 with a single dose, and an additional 10,820 have received their second dose.
Out of 254 Texas counties, Hays County is the 17th highest population that falls into Phase 1B for ages 16-65 with any medical condition.
The number of COVID-19 vaccine doses shipping to Texas providers continues to climb, with 676,280 first doses allocated to the state by the federal government for the week of March 1.
The DSHS has instructed the Centers for Disease Control and Prevention to ship those doses to 522 providers in 199 counties.
The total includes 84,240 doses for federally-supported sites in Houston and North Texas and another 52,650 unused doses returned to Texas by the Federal Pharmacy Partnership for Long-Term Care.
Texas providers swiftly resumed vaccination following last week’s winter storms and have now administered more than 5 million doses. More than 3.3 million people have received at least one dose, and almost 1.7 million are fully vaccinated.
Progress continues in vaccinating adults 65 years old and older, with more than 40 percent have received at least one dose and nearly 1 in 5 fully vaccinated.
Hays County Local Health Department (HCLHD) reports two COVID-related fatalities, a San Marcos man in his 70s and a San Marcos woman in her 60s.
The department also reports 34 new lab-confirmed cases along with one (1) new hospitalization and three (3) new hospital discharges. There are 0 additional persons considered recovered. The total number of persons considered recovered is 15,617.
ADDITIONAL VACCINE INFORMATION & HELPUL LINKS
RELATED HAYS COUNTY & TEXAS VACCINE STORIES
RELATED STORIES…
- Texas receives 676,280, Hays County 4,680 in weekly vaccine allocations
- Hays County To Receive 4,680, Texas Nearly 600,000 Doses Of Vaccine This Week
- Hays County To Receive 4,450, Texas More Than 400,000 Doses Of Vaccine This Week
- Hays County To Receive 1,950, Texas To Receive More Than 400,000 Doses Of Vaccine This Week
- Hays County Residents Can Now Pre-Register For A COVID-19 Vaccination
- Hays County Notified Of Change COVID Business Capacity, Hays OES Talks Vaccine Wait List
- Hays County Releases Frequently Asked Questions On Vaccine Distribution
- Some Hays County Residents Given Advanced Notice Of Available Vaccine. Were You One Of Them?
 .
.
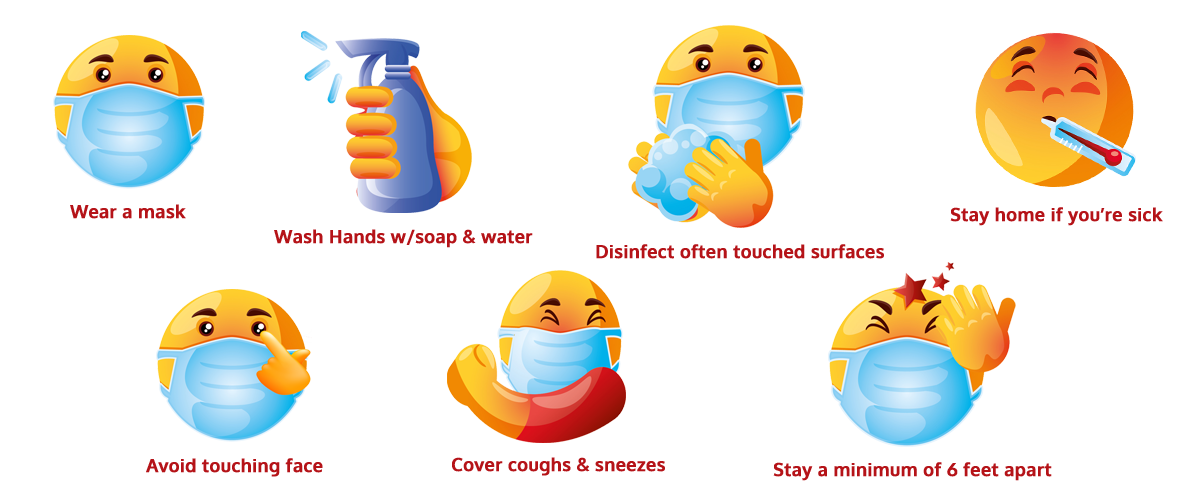
Not only for your safety but the protection of others, please follow the following guidelines.
.
.
.
NOTE: HAYS COUNTY CASE STATS & INFORMATION UPDATED FRIDAY, MARCH 5, AT 1:40 PM.
HAYS COUNTY & COVID-19: THE AFFECTS
* Disclaimer: As this is a fast-moving situation, the information included below is provisional and subject to change.
*If listed as NR, the latest information has not been released by Hays County; the table will be updated when the data is available. Coronavirus case and demographic stats are reported Monday – Friday exclusively. No case stats will be given on weekends and holidays.
HAYS COUNTY CORONAVIRUS DAILY UPDATE
HAYS COUNTY POPULATION: 230,191
HAYS COUNTY
|
MARCH 4, 2021 |
MARCH 5, 2021 |
FATALITY %
|
|
|
COVID POSITIVE TEST %
|
|
|
| COVID NEGATIVE TEST % |
|
|
HOSPITALIZATION %
|
|
|
RECOVERED %
|
|
|
| TOTAL TESTS (*provisionary / includes pending cases) |
|
|
| NEW DAILY TESTS (*provisionary) |
1,063
|
659 |
TOTAL LAB CONFIRMED
(*provisionary) |
|
|
| ACTIVE (*provisionary) |
614
|
646 |
| NEW DAILY CONFIRMED |
23
|
32 |
| PROBABLE CASES |
1,813
|
1,828 |
| TOTAL RECOVERED |
|
|
| DAILY RECOVERED |
0
|
0 |
| CASES REMOVED (*Reported On Fridays) |
N/A |
2 |
| FATALITIES |
225
|
227 |
| TESTED NEGATIVE (*provisionary) |
126,940
|
127,567 |
| TOTAL HOSPITALIZATIONS |
754
|
755 |
| CURRENT HOSPITALIZATIONS |
16
|
14 |
BY CITY
HAYS COUNTY POPULATION: 230,191
*Hays county public health updates the following information Monday – Friday only
*Note: the totals and percentage rates below include “probable cases.” percentages may be rounded up.
| CITY |
CASE TOTALS
|
ACTIVE CASES /
%
|
RECOVERED /
% |
FATALITIES /
% |
| AUSTIN |
494 |
35 /
7.1%
|
449 /
90.9% |
10 /
2% |
| BEAR CREEK |
4 |
0 /
0% |
4 /
100% |
0 /
0% |
| BUDA |
2,922 |
142/
4.9% |
2,746 /
94% |
34 /
1.2% |
| CREEDMOOR |
3 |
0 /
0% |
2 /
66.7%
|
1 /
33.3% |
| DRIFTWOOD |
205 |
6/
2.9% |
198 /
96.6% |
1 /
0.5% |
| DRIPPING SPRINGS |
758 |
41 /
5.4% |
708 /
93.4% |
9 /
1.2% |
| HAYS |
3 |
0 /
0% |
3 /
100% |
0 /
0% |
| KYLE |
5,340 |
195 /
3.7% |
5,074 /
95% |
71 /
1.3% |
| MANCHACA |
25 |
2 /
8% |
23 /
92% |
0 /
0% |
| MAXWELL |
56 |
11 /
19.6% |
44 /
78.6% |
1 /
1.8% |
| MOUNTAIN CITY |
40 |
1 /
2.5% |
38 /
95% |
1 /
2.5% |
| NIEDERWALD |
89 |
1 /
1.1% |
88 /
98.9% |
0 /
0% |
| SAN MARCOS |
5,855 |
173 /
3% |
5,594 /
95.5% |
88/
1.5% |
| UHLAND |
29 |
1 /
3.4% |
28 /
96.6% |
0 /
0% |
| WIMBERLEY |
660 |
38 /
5.8% |
612 /
92.7% |
10 /
1.5% |
| WOODCREEK |
7 |
0 /
0% |
6 /
85.7% |
1 /
14.3% |
| TOTAL |
16,490 |
646 /
3.9%
|
15,617 /
94.7%
|
227 /
1.4%
|
BY AGE AND GENDER
*Hays County Public Health updates the following information Monday – Friday only
| AGE RANGE |
FEMALE |
MALE |
TOTAL |
| 0-9 yrs. |
521 |
533 |
1,054 |
| 10-19 yrs. |
1,305 |
1,124 |
2,429 |
| 20-29 yrs. |
2,428 |
2,255 |
4,683 |
| 30-39 yrs. |
1,329 |
1,200 |
2,529 |
| 40-49 yrs. |
1,192 |
1,043 |
2,235 |
| 50-59 yrs. |
822 |
833 |
1,655 |
| 60-69 yrs. |
556 |
518 |
1,074 |
| 70-79 yrs. |
264 |
264 |
528 |
| > 80 yrs. |
186 |
117 |
303 |
| Total |
8,603 |
7,887 |
16,490 |
BY ETHNICITY AND GENDER
*Hays County Public Health updates the following information Monday – Friday only
| ETHNICITY |
FEMALE |
MALE |
TOTAL |
% OF CASES |
| HISPANIC |
4,253 |
3,852 |
8,105 |
49.2% |
| NON-HISPANIC |
2,902 |
2,697 |
5,599 |
34.0% |
| NOT-SPECIFIED |
1,448 |
1,338 |
2,786 |
16.9% |
| TOTAL |
8,603 |
7,887 |
16,490 |
100.0% |
BY RACE
*Hays County Public Health updates the following information Monday – Friday only
| RACE |
PERCENTAGE OF CASES |
| AMERICAN INDIAN |
0.1% |
| ASIAN |
1.0% |
| BLACK |
2.7% |
NATIVE HAWAIIAN
/ PACIFIC ISLANDER |
0% |
| WHITE |
69.6% |
| OTHER |
1.0% |
NOT SPECIFIED
/ UNKNOWN |
25.6% |
DEFINITIONS: CASE & CLINICAL CRITERIA
Confirmed: A case that is laboratory confirmed using a molecular diagnostic test (for example, PCR, Curative RCT-PCR, and Abbott ID Now RCT-PCR)
Probable: A case that:
› Using a method approved or authorized by the FDA or designated authority meets presumptive laboratory evidence of
- Detection of specific antigen (Ag) in a clinical specimen, OR
- Detection of a specific antibody in serum, plasma, or whole blood indicative of a new or recent infection
› AND meets clinical criteria
OR
› Meets vital records criteria (death certificate lists COVID-19 disease or SARS-CoV-2 as a cause of death or a significant condition contributing to death) with no confirmatory laboratory testing performed for COVID-19.
Clinical criteria:
› At least two of the following symptoms: fever (measured or subjective), chills, rigors, myalgia, headache, sore throat, new olfactory and taste disorder(s); OR
› At least one of the following symptoms: cough, shortness of breath, or difficulty breathing; OR
› Severe respiratory illness with at least one of the following:
- Clinical or radiographic evidence of pneumonia, or
- Acute respiratory distress syndrome (ARDS)
TEXAS & COVID-19: THE AFFECTS
NOTE: TEXAS CASE STATS & INFORMATION UPDATED FRIDAY, MARCH 5, AT 1:50 PM
TEXAS POPULATION: 29 MILLION
| STATE OF TEXAS |
MARCH 4, 2021 |
MARCH 5, 2021 |
COVID POSITIVE %
|
|
|
FATALITY %
|
|
|
| TOTAL TESTED (*provisionary) |
|
|
| TOTAL MOLECULAR TESTS (*runs a day behind) |
|
|
| TOTAL ANTIGEN TESTS (*runs a day behind) |
|
|
| TOTAL ANTIBODY TESTS (*runs a day behind) |
1,022,798 |
1,025,537 |
| TOTAL CONFIRMED CASES |
|
|
| NEW DAILY CASES (*provisionary) |
|
|
| ACTIVE (*provisionary) |
152,267 |
147,360 |
| NEW PROBABLE CASES |
|
|
| TOTAL PROBABLE CASES |
|
|
| TOTAL RECOVERED (*provisionary) |
|
|
| TOTAL RECOVERED OVER PAST 24 HOURS (*provisionary)18,957 |
8,589 |
11,490 |
| CURRENT HOSPITALIZATIONS (*provisionary) |
5,263
|
5,065 |
| TOTAL FATALITIES (*provisionary) |
|
|
| FATALITIES OVER PAST 24 HOURS (*provisionary) |
|
|
FEMALE % (updated on Friday’s)
|
33.4% |
33.5% |
MALE % (updated on Friday’s)
|
65.4% |
65.3% |
UNKNOWN % (Gender) (updated on Friday’s)
|
1.2% |
1.2% |
ASIAN % (updated on Friday’s)
|
1.2% |
1.2% |
BLACK % (updated on Friday’s)
|
16.7% |
16.7% |
HISPANIC % (updated on Friday’s)
|
36.7% |
36.6% |
OTHER % (updated on Friday’s)
|
0.6% |
0.6% |
WHITE % (updated on Friday’s)
|
33.7% |
33.8% |
UNKNOWN % (updated on Friday’s)
|
11.1% |
11.1% |
*NOTE: U.S. & INTERNATIONAL CASE COUNTS & STATS UPDATED ON FRIDAY, MARCH 5, AT 3:02 AM
U.S. CORONAVIRUS CASE OVERVIEW
*Disclaimer: This data is provisional and the situation changes rapidly and might not reflect some cases still being reported.
US POPULATION: 330 MILLION
| U.S. OVERVIEW
|
POSITIVE /
% RATE
|
FATALITIES /
% RATE
|
RECOVERED
|
ACTIVE
|
MARCH 5
(*provisionary) |
29,526,086 /
8.95% |
533,636 /
1.81% |
20,093,442 |
8,899,008 |
MARCH 4
(*provisionary) |
29,456,377 /
8.93% |
531,652 /
1.80%
|
20,003,325 |
8,921,400 |
Population Source: Census Bureau Population Clock
INTERNATIONAL CORONAVIRUS CASE OVERVIEW
*Disclaimer: This data is provisional and the situation changes rapidly and might not reflect some cases still being reported.
WORLD POPULATION: 7.7 BILLION
WORLDWIDE
OVERVIEW |
POSITIVE /
% RATE
|
FATALITIES /
% RATE |
RECOVERED |
ACTIVE |
MARCH 5
(*provisionary)
|
116,273,001 /
1.51% |
2,582,799 /
2.22% |
91,935,945 |
21,754,257 |
MARCH 4
(*provisionary)
|
115,838,489 /
1.50% |
2,573,248 /
2.22% |
91,526,523 |
21,738,718 |
Population Source: Census Bureau Population Clock