COVID-19 is spreading fast among Texas’ unvaccinated. Here’s who they are and where they live.
There are two main groups within Texas’ unvaccinated population: white conservatives in rural areas, and Hispanic and Black people in big cities.
By Colleen Deguzman and Mandi Cai
Exhortations to get a coronavirus vaccine are all around, but Brad Offutt has decided to reject them.
The 53-year-old is a pain therapist in Marble Falls, a town of about 6,000 people in Burnet County, and he said he wants to see the vaccines get full approval — rather than the current emergency authorization — by the Food and Drug Administration before he gets one. But even then, Offutt said that the chances of him doing so are slim since he “doesn’t feel threatened by COVID personally.”
Instead, he’s made the decision to “take the risk of getting COVID.”
The coronavirus vaccines have been thoroughly tested and found to be safe and effective. More than 340 million doses have been given in the U.S., and side effects have been determined by the FDA and independent researchers to be extremely rare and far less substantial than the dangers of getting COVID-19, which has killed more than 52,000 Texans as of Aug. 2.
Public health experts say getting as many people vaccinated as possible is the best and fastest way to end the pandemic — but Offutt’s hesitancy is common. He is one of 14 million Texans as of Aug. 1 who, about eight months after the first batch of vaccines first rolled out, have remained unvaccinated.
Many of those unvaccinated are children who are ineligible to receive the shots; around 5 million Texans are under 12. But still 83% of Texans, or 24 million residents, are eligible for the vaccine.
With 15 million Texans who have received at least one shot as of Aug. 1, that leaves 9 million eligible Texans who have not gotten their vaccine yet.
This places the state’s vaccination rate at 36th in the country and has helped drive another troubling wave in the pandemic. COVID hospitalizations in Texas quadrupled in July.
Preliminary data from the state indicates that more than 99.5% of people who died due to COVID-19 in Texas from Feb. 8 to July 14 were unvaccinated.
The percentage of fully vaccinated residents has gone from 3% to 42% in that time span.
The Texas Tribune analyzed the demographic and geographic trends of Texans who have not gotten their shot yet. Here are some of our main findings:
- In Texas’ largest counties — Harris, Dallas, Tarrant, Bexar, and Travis — neighborhoods with the highest proportions of Black and Hispanic populations are some of the least vaccinated areas.
- Neighborhoods with median incomes below the county’s median income also hold vaccination rates lower than that of the county’s.
- Rural counties have consistently lagged behind the state’s fully vaccinated rate.
Offutt lives along Lake Marble Falls with his wife, Dr. Amy Offutt, an integrative medicine physician who is also choosing not to get vaccinated. He said they have enough space there not to have to worry about being in large crowds where the likelihood of being exposed to the virus is high.
Marble Falls is a conservative stronghold; 76% of its voters cast their ballots for Trump in 2020. The city is part of Burnet County, where 40% of residents are fully vaccinated — far behind the rates of neighboring Travis and Williamson counties, which are both around 56%.
Percent fully vaccinated by county
The percentage of residents fully vaccinated by county shows which areas have higher rates of immunization compared to the statewide rate.
Note: Doses administered at military bases, federal prisons, and Veterans Affairs Hospitals are not included.Sources: Texas Department of State Health Services and U.S. Census Bureau population estimates
Credit: The Texas Tribune
“It matters if you live in a city which is more densely populated, versus where we live which is not that populated and most of what we do are outdoor things,” Brad Offutt said.
Data shows that’s not necessarily true. Across Texas, the counties with the highest case rates are outside the urban centers.
New confirmed and probable cases of coronavirus in Texas in the last two weeks
The Texas Tribune is measuring the rate of confirmed and probable cases per 1,000 residents in each county in the last two weeks. This shows where numbers are increasing in the state.
Sources: Texas Department of State Health Services and U.S. Census Bureau population estimatesCredit: The Texas Tribune
Still, attitudes like Offutt’s are common among white conservative rural folks, said Dr. David Lakey, the chief medical officer of the University of Texas System. According to the Tribune’s analysis, 33% of people in rural or nonmetropolitan counties are fully vaccinated as of Aug. 1, behind the state’s rate of 44%.
Since April, rural counties have lagged the state in vaccinations
A third of people in rural counties are fully vaccinated, compared to more than 40% of the entire state.
Note: In this chart, rural counties are counties outside of metropolitan statistical areas defined by the Office of Management and Budget.Source: Texas Department of State Health Services, 2019 American Community Survey 5-year estimates
In the state’s biggest cities, the story is different. Vaccination rates are higher in the metropolitan areas, but the cities’ poorer neighborhoods and the neighborhoods with more people of color tend to have much lower vaccination rates.
Overall, Black and Hispanic Texans hold the lowest vaccination rates among racial groups statewide, at 28% and 35% respectively.
In Texas’ five most populous counties, disparities persist in vaccination rates
Counties are sorted by the gap in percentage points between fully vaccinated rates. Dallas has the largest gap and is shown first.
Note: Vaccination data is as of July 26.Source: Texas Department of State Health Services, 2019 American Community Survey 5-year estimates
Credit: Mandi Cai
“In an area like Houston or Dallas or Austin, the overall rates may look good, but you can have significant differences and disparities between one ZIP code and another,” Lakey said. “… one part of town can be very different from another part of town.”
For example, in Dallas County, 58% of the people in neighborhoods that are majority white were fully vaccinated as of July 26. Those rates are far ahead of neighborhoods that are majority Black and Hispanic, which are 37% vaccinated.
Black and Hispanic neighborhoods are some of the least vaccinated areas in Harris and Dallas counties
Around 40% of the state’s Black population and around a quarter of the state’s Hispanic population reside in just these two counties.
to sway their vaccination rates by more than 10 percentage points were grayed out.
Source: Texas Department of State Health Services, 2019 American Community Survey 5-year estimates
Credit: Mandi Cai
Lakey added that East Texas’ vaccination rates have been lagging behind the rest of the state since “it tends to be older, and it’s an area of the state that has a significant African American population and also a significant conservative white population and is also a more rural area.”
Why are they unvaccinated?
Mistrust is the leading cause of vaccine hesitancy, Lakey said, and the core of the mistrust usually depends on a person’s culture.
Hesitancy for white conservatives, he said, hinges on “distrust of government,” while for Hispanic and Black residents it’s often a “lack of trust in the health care system” because of generations of disparities in the American system.
“For some individuals who have not had a lot of experience interacting in the health care system — perhaps they don’t have a primary care physician — this might create further doubt when we start talking about a vaccine because these kinds of experiences are new,” said Dr. John Carlo, CEO of Prism Health North Texas.
He added that while he wishes fewer people were hesitant about the vaccine, he understands the uncertainty.
“I think the big thing that I would say is that we just have to continue to listen and see where people are on this because oftentimes, people aren’t completely opposed to it,” Carlo said. “There’s a lingering concern and maybe questions could be answered.”
Alma Peña, a 40-year-old Austin resident, didn’t trust the coronavirus vaccine when it first came out and resisted getting it all of spring.
“I was afraid that something would happen to me when I got the vaccine,” she said in Spanish.
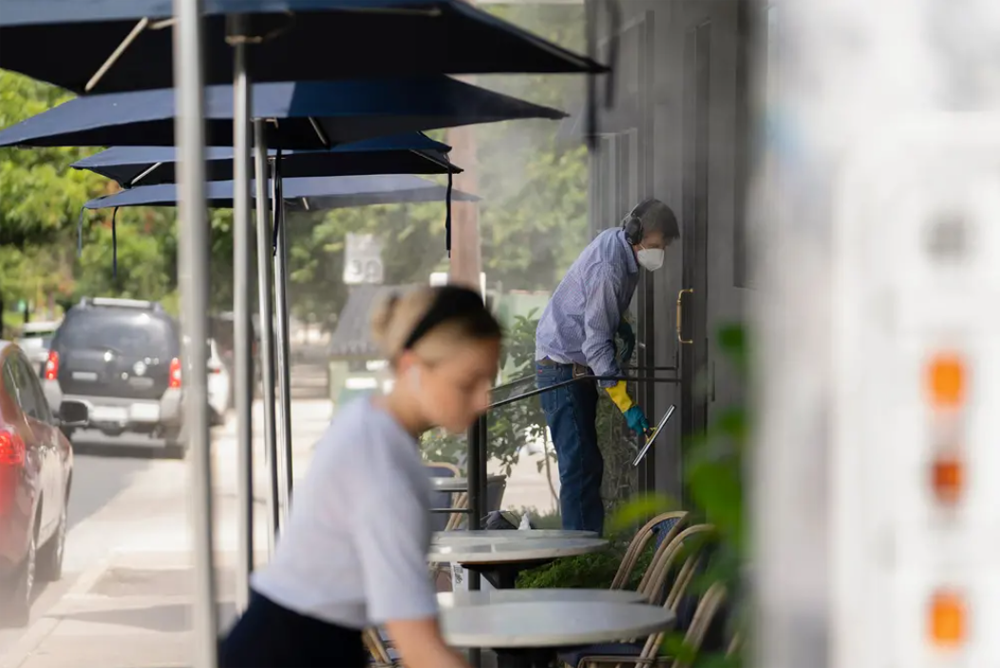
But the recent surge of cases and hospitalizations made being unvaccinated scarier than the shot’s potential side effects for Pe?a. She’s a housecleaner, and since she spends most of her days hopping from home to home, she pushed her apprehensions aside and rolled up her sleeve in July.
“I’m afraid,” Peña said.
She got her shot in early July through the University of Texas School of Nursing’s Vaccine Administration Mobile Operations, or VAMOS, which strives to vaccinate vulnerable populations in Austin. She went to one of their weekly clinics held at the parking lot of First Spanish Seventh Day Adventist Church, which is just around the corner from her house.
She took her 13-year-old son Joseph to get his first dose on July 21 at the same church, right before he starts seventh grade in August.
The way to convince more families like the Peñas to get vaccinated, Carlo said, is to “make sure we have one message with many voices.”
Of the six ZIP codes in Travis County in which Hispanics make up more than half of residents, all but one ZIP code has a fully vaccinated rate lower than that of the county’s 56%, according to the Tribune’s analysis.
The gap is also seen when comparing neighborhoods by median income. Of the 14 ZIP codes that have median incomes lower than that of the county’s, 10 are also under the countywide fully vaccinated rate. Of the 20 Travis County ZIP codes with incomes above the county’s median income, just four are below the county’s rate.
In Travis County, vaccination rates in Hispanic communities have fallen behind whiter areas
There are nearly 200,000 people living in Travis County’s majority Hispanic ZIP codes — 42% are fully vaccinated as of July 26, compared with 62% of the county’s majority white ZIP codes.
Note: Vaccination data is as of July 26. ZIP codes with margin of errors for their population estimates large enough to sway their vaccination rates by more than 10 percentage points were grayed out.Source: Texas Department of State Health Services, 2019 American Community Survey 5-year estimates
Credit: Mandi Cai
Ana Todd is the director of the VAMOS clinic where Joseph got his shot and said a lack of easy access to health care and transportation are also key reasons why some Black and Hispanic residents haven’t received a vaccine. But above all, “mistrust is one of the biggest reasons” Texans are turning away from the shot, she said.
Todd said efforts that take the time to meet and talk to residents are crucial to mending the relationship between Austin’s Hispanic and Black communities and the health care system. And that’s why the organization hosts clinics at local churches.
“People trust the churches,” Todd said.
Every Wednesday since May, VAMOS partners with the Central Texas Food Bank to make its weekly food drive at First Spanish Church a vaccination clinic as well. Some regulars for the food bank stop by not knowing about the vaccine clinic. While they wait in line to pick up food, a volunteer for VAMOS asks them if they would like to get vaccinated.
Sometimes, Todd said, hesitant residents, decline. But they’ll come back the following week, and she’ll ask them again if they want to consider getting the vaccine. That was the case a couple months ago when a mother and daughter were in line for the food drive. Todd said she asked the duo if they wanted to get their vaccine and the mother immediately declined, but the daughter said, “let me think about it.”
Todd continued to tell the daughter about the importance of the vaccine, and she eventually agreed to get the shot. After watching her daughter get vaccinated, the mother told Todd she would take the week to think about getting hers as well.
“We have been consistently working to build trust,” Todd said. “And even more importantly, we’ve been listening to why they don’t want to get the vaccine or why they haven’t.”
She added that being Venezuelan and treating a majority Hispanic neighborhood helps her build trust with residents.
“I understand when somebody says to me ‘Dios me va a proteger’ — ‘God is going to protect me,’” Todd said. “So when they tell me that, I know the context. I know how to guide the conversation and talk about how we’ve been given the tools to take care of ourselves. … And so it’s about framing the conversation so that it’s person-centered and patient-centered.”
Dr. Lane Aiena, the director of Walker County’s COVID-19 medical response team, said he has a similar approach to convincing his rural community to get them vaccinated: having one-on-one conversations with his patients.
“I have to be very mindful that I’m frustrated with the situation but not the person,” Aiena said, who is also a doctor in Huntsville. “No one is anti-vaccine just because they woke up one the morning and decided ‘I’m not going to take this shot.’ They heard something somewhere. They have a reason to be hesitant and I’m asking them to put something in their body, and they have the right to want to know about that.”
A note on methodology:
Higher- and lower-income ZIP codes are defined as ZIP codes with median incomes above or below the county’s median after accounting for margin of error. ZIP codes were included in a demographic majority if more than half of its residents are in that demographic group after accounting for margin of error. Income and racial demographic data were taken from the 2019 U.S. Census Bureau’s American Community Survey.
This story originally published by the Texas Tribune.