
Dallas Fed 3rd Quarter Report: Oil And Gas Expansion And Pricing Forecasts
![]() Special questions this quarter focus on pipeline constraints and the impact of crude oil price differentials in the Permian, the impact of steel tariffs, and supply and demand expectations for the global oil market in 2019…
Special questions this quarter focus on pipeline constraints and the impact of crude oil price differentials in the Permian, the impact of steel tariffs, and supply and demand expectations for the global oil market in 2019…
![]()
Energy sector activity maintained its strong momentum in third quarter 2018, according to oil and gas executives responding to the Dallas Fed Energy Survey.
The business activity index—the survey’s broadest measure of conditions facing Eleventh District energy firms—dipped very slightly from 44.5 in the second quarter to 43.3 in the third but remained near the highest level since the survey began.
The business activity index for oilfield services firms fell from 54.2 to 45.9, suggesting a slight deceleration in growth for those firms. Meanwhile, the business activity index for exploration and production (E&P) firms rose from 37.2 to 41.8.
Positive readings in the survey generally indicate expansion, while readings below zero generally indicate contraction. All indexes in the latest survey reflected expansion on a quarterly basis.
Oil and gas production increased for the eighth quarter in a row, according to executives at E&P firms. The oil production index moved down from 39.0 in the second quarter to 34.8 in the third. This suggests crude production rose at a slightly slower pace relative to last quarter.
Meanwhile, the natural gas production index edged up from 33.4 to 35.5, its highest level since the survey began. This suggests gas production rose at a slightly faster pace relative to last quarter.
Utilization of equipment by oilfield services firms slightly increased in the third quarter, with the corresponding index at 44.8, up three points from the second quarter. Input costs on the services side continued rising as the index jumped from 36.3 to 46.6.

The index of prices received for oilfield services remained unchanged at 23.2, suggesting prices rose at the same pace as last quarter.
Labor market indexes pointed to continued growth in employment and work hours in the third quarter. The rate of growth slowed though, particularly for oilfield services. The employment index for services fell sharply from 44.1 to 31.7.
The hours worked index for services also fell from 50.8 to 41.0. Meanwhile, the employment index for E&P firms increased from 11.6 to 17.4, the highest level since the survey began. The aggregate wages and benefits index remained positive but fell from 27.9 to 23.5.
The company outlook index posted a 10th consecutive positive reading and edged up one point to 46.4 in the third quarter. The uncertainty index rose 10 points to 8.8, suggesting that uncertainty regarding firms’ outlooks increased this quarter.
This increase was particularly prominent among oilfield services firms, where the outlook uncertainty index jumped nearly 22 points to 14.7.
The survey this quarter received a larger-than-average quantity of comments from respondents, particularly regarding pipeline constraints and price differentials in the Permian Basin.
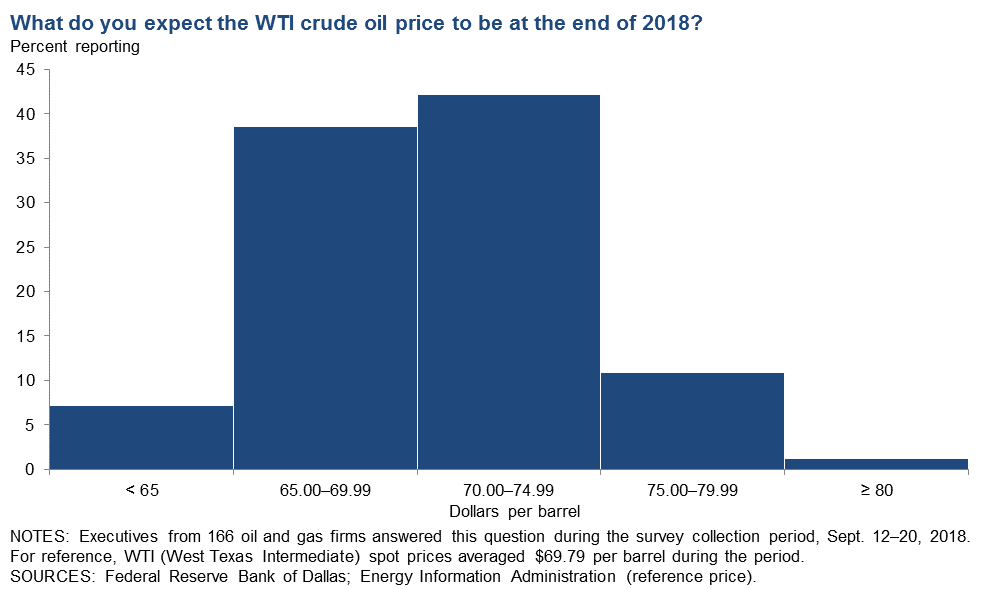
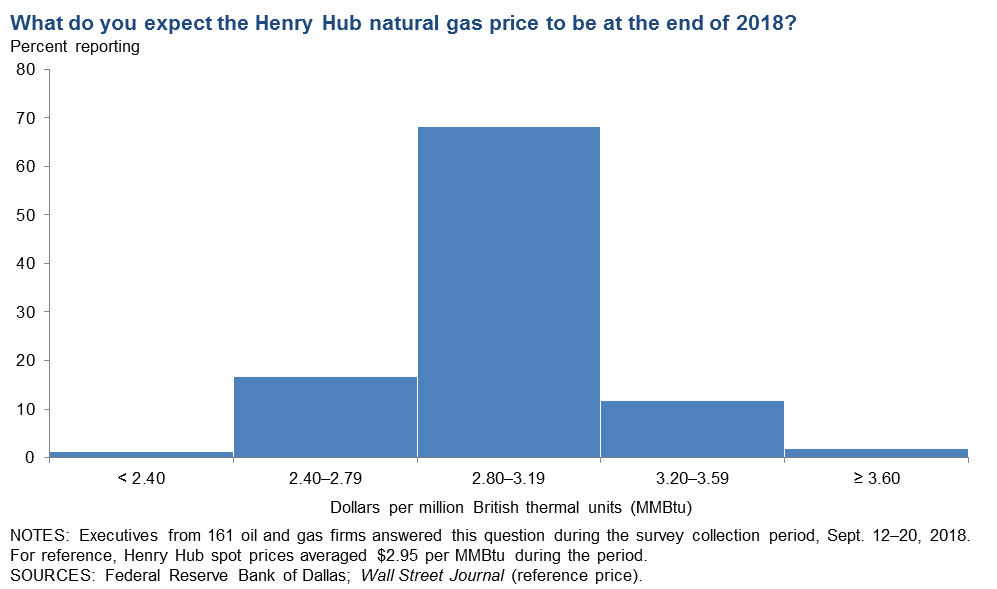
On average, respondents expect West Texas Intermediate (WTI) oil prices to be $68.81 per barrel by year-end 2018, with responses ranging from $55 to $85 per barrel. Respondents expect Henry Hub natural gas prices to end 2018 at $2.94 per million British thermal units (MMBtu).
The year-end 2018 price expectations for WTI oil and Henry Hub natural gas were close to the spot price during the survey collection period. For reference, WTI spot prices averaged $69.79 per barrel, and Henry Hub spot prices averaged $2.95 per MMBtu during the survey collection period.
![]()
Price Forecasts
Third Quarter | October 2018
West Texas Intermediate Crude
![]()
Are you reading on a mobile device & can’t see the entire table?
| West Texas Intermediate crude oil price (dollars per barrel), year-end 2018 | ||||
| Indicator | Survey Average | Low Forecast | High Forecast | Price During Survey |
|---|---|---|---|---|
| Current quarter | $68.81 | $55.00 | $85.00 | $69.79 |
| Prior quarter | $65.68 | $50.00 | $92.00 | $65.88 |
![]()
Henry Hub Natural Gas
![]()
Remember….scroll right!
| Henry Hub natural gas price (dollars per MMBtu), year-end 2018 | ||||
| Indicator | Survey Average | Low Forecast | High Forecast | Price During Survey |
|---|---|---|---|---|
| Current quarter | $2.94 | $2.00 | $4.00 | $2.95 |
| Prior quarter | $2.91 | $2.00 | $4.00 | $2.96 |
NOTE: Price during survey is an average of daily spot prices during the survey collection period.
SOURCES: Energy Information Administration; Wall Street Journal.
![]()
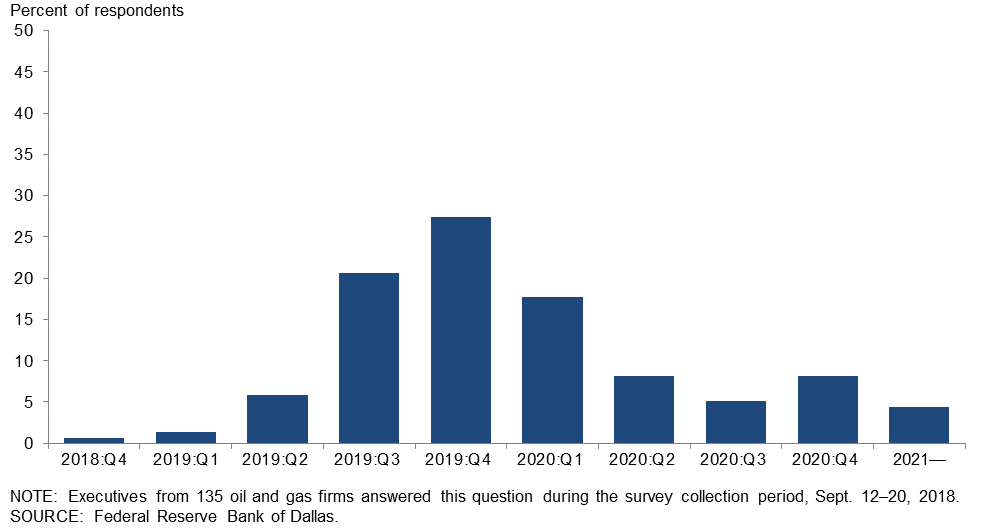
In what quarter do you expect crude oil pipeline capacity will be sufficient to alleviate the current takeaway constraints in the Permian Basin?
Over half of oil and gas executives responding—56 percent—said they expect crude oil pipeline capacity will be sufficient to alleviate the current takeaway constraints by the end of 2019, with the remaining 44 percent saying it would be 2020 or later. The most frequent response—selected by 27 percent of executives—was fourth quarter 2019.
![]()
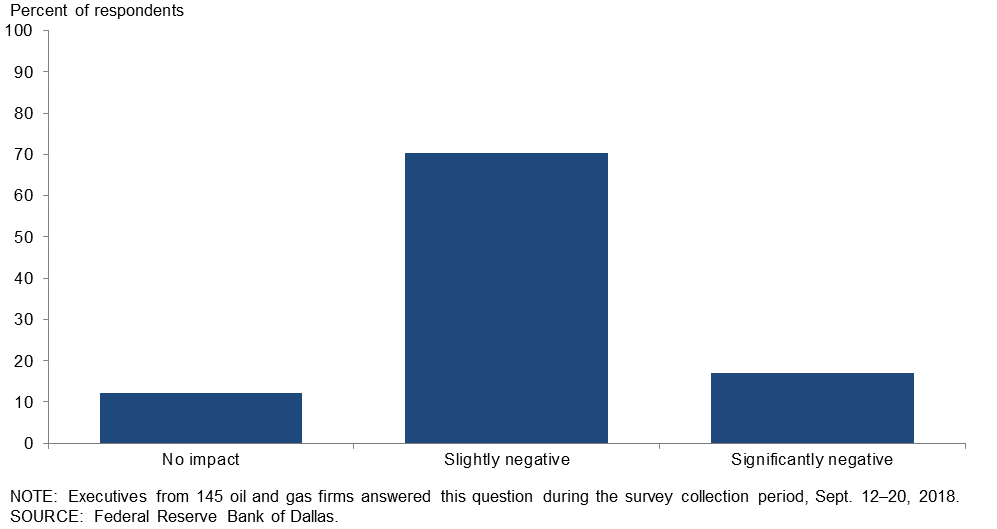
Do you expect recent crude oil price differentials between WTI Midland and Cushing to have an impact on oil production growth in the Permian Basin over the next six months?
The majority of the executives—70 percent—said that they expect recent crude oil price differentials between WTI Midland and Cushing to have a slightly negative impact on oil production growth in the Permian Basin over the next six months. Seventeen percent expect significant impacts, while 12 percent expect no impact.
![]()
![]()
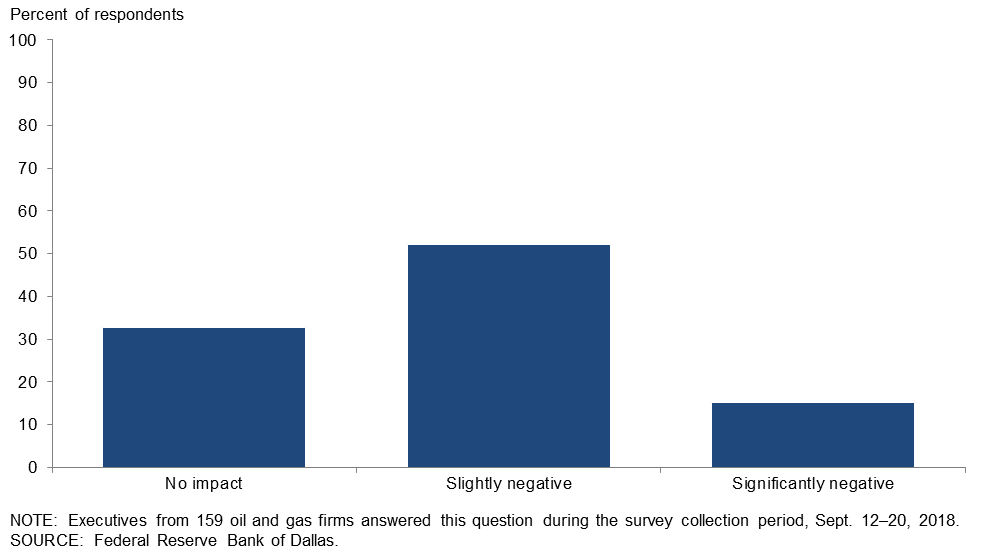
What impact has steel import tariffs (25 percent) had on your business so far?
A little over half the executives—52 percent—said the steel import tariffs (25 percent) have had a slightly negative impact on their business so far. Thirty-three percent noted no impact, while the remaining 15 percent said the steel import tariffs have had a significantly negative impact on their business.
![]()
![]()
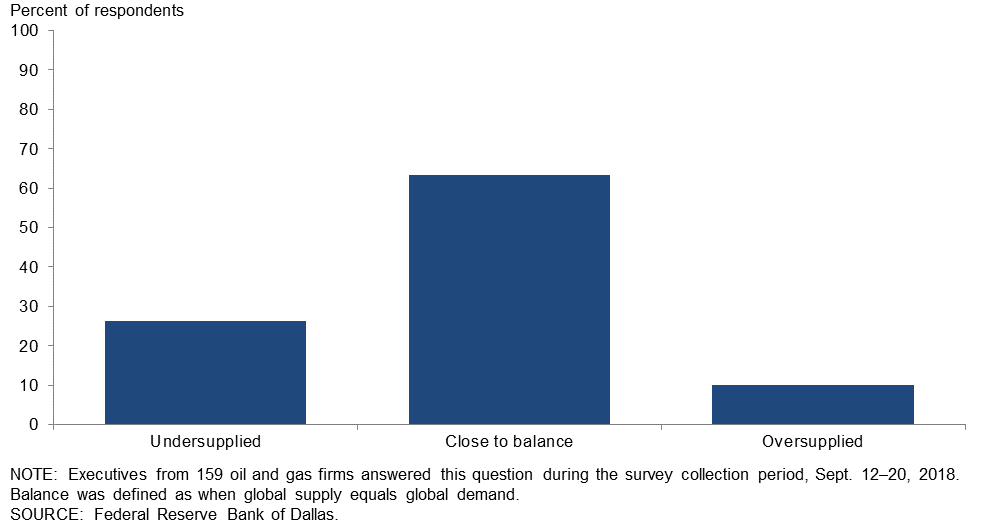
The global oil market moved into balance in the first half of 2018. In 2019, do you think the global market will be undersupplied, oversupplied or close to balance?
The majority of oil and gas executives responding—64 percent—said they think the global oil market will be close to balance in 2019. Roughly a quarter of all respondents (26 percent) think the market will be undersupplied, while the remaining 10 percent think it will be oversupplied.
![]()
Energy Slideshow, October 2018
The energy slideshow provides charts for regional, national and international energy markets highlighting oil and gas prices, supply, demand, stocks, rigs and more, along with a selection of charts from our quarterly energy survey.
To view the Dallas Federal Reserves Energy Slideshow click HERE.
Special Questions & Comments
Exploration and Production Firms
- The steel tariffs have added approximately $100,000 of costs to each of our wells. Some thought should be given to removing the tariffs when domestic mills are not currently running the products. Significant supply chain savings to the Permian could also be realized if there was an interstate or main lane connector between Interstate 10 and Midland–Odessa. This connector would dramatically remove road congestion and accidents from the farm-to-market road system and improve supply chain productivity.
- Increased uncertainty in geopolitics, oil supply, the steel tariff and the transportation bottleneck keep us on the edge of our seats on a daily basis.
- Skilled labor shortages (CDLs, mechanics, electricians, welders, etc.) will limit service delivery, timing and quality, and thus negatively impact production growth.
- Profitability and cash flows will drive the growth in investments more and more over time, with less emphasis on the oil price.
- The skinny economics in the Permian impacts publicly traded and private producers. The private equity groups are rearranging their deck chairs as they shuffle assets from one owner to another—just like the savings and loans in the ‘80s. They desperately need a price spike to open the exits.
- I am not an operator in the Permian. Investment in the Permian seems overblown with outrageous costs and little real actual returns for the huge volumes of money being “churned.” I believe the Permian operators/industry is hurting itself by flaring and venting natural gas rather than containing that product or using it. This will negatively impact the entire domestic industry, not just the Permian producers. I believe Texas regulators are being irresponsible in allowing this rampant pollution and waste of natural resources.
- Permian gas takeaway is also an issue, with Waha trading at half of Henry Hub recently. The infrastructure to place output in central Mexico demand centers has been delayed, with project schedules more opaque south of the border. Hopefully, in the next six months, this is resolved.
- Once again, the perceived geopolitical/military/terrorist exposures will probably define the price of crude oil in 2019. It is difficult to imagine an extended period of time without major disruptions in the market from one or more of those exposures during 2019. Any major disruption in the Middle East could significantly exaggerate the price of crude. The capacity of any of the major producers to significantly increase daily production from current levels is limited, at best, and that is a formula for an exaggerated price of crude if a disruption does occur.
- The present administration’s efforts to boost the American economy have ripple effects worldwide. Our economy has the largest demand for energy compared to any other country in the world. This, along with the general worldwide growth, is pushing up demand for energy in general. Iran is the question as to what price will be for oil. America is becoming a major exporter. Demand for liquefied natural gas is also a key driver for natural gas prices. Storage volume today, the upcoming winter and Gulf hurricanes may cause price spikes for natural gas.
- Oil prices’ current stability is the result of a managed market and not truly representative of an optimal supply-and-demand market. Ultimately, demand will become the driver on price, and the current excess capacity being held off market can come back in. However, it is always the unknowns in the oil market that confound prognostication.
![]()
Oil and Gas Support Services Firms
- If the Iran sanctions remove more than 1 million barrels per day and Venezuela continues in decline, we could see $90 per barrel for Brent oil. Shale producers in the U.S. will not be able to ramp up production as fast in 2019 as we have over the past two years. We have seen the benefit of most of the low-hanging fruit (core acreage has been drilled, lateral lengths cannot get significantly longer, high-density pad drilling has added most of the potential gain, etc.). Calls for increased production could only be answered by Saudi Arabia and Russia, and I doubt they have the excess capacity to satisfy demand growth. International budgets for drilling should finally start growing again in 2019, but those are longer-term projects that will not deliver increased oil production for three to five years.
- There are too many factors affecting the price of oil to justify a guess as to oil’s future.
- With our service primarily on the Gulf Coast, where activity has been near a standstill as far as new production coming on line, we are not privileged to increase volumes from the Permian Basin.


