

Was Household Income The Highest Ever In 2019?
The Census Bureau is still studying the full impact of the pandemic on income data...
By Jonathan Rothbaum
The U.S. median household income was $68,703 in 2019, 6.8% higher than in 2018, according to U.S. Census Bureau statistics released last week.
That’s the highest median U.S. household income since the bureau began recording it. But the COVID-19 pandemic affected who responded, potentially biasing the estimate upward.
So, was household income last year really the highest on record?
At first glance, the answer seems obvious — income last year was up substantially from the previous year and surpassed all other years, including the median income in 2007 ($62,090 in 2019 dollars) and 1999 ($62,641 in 2019 dollars).
However, even before the pandemic, making comparisons to years prior to 2017 required caution, since recent estimates reflect changes implemented to the survey.
The newly released 2019 income, poverty, and health insurance statistics come from the Current Population Survey Annual Social and Economic Supplement, known as CPS ASEC.
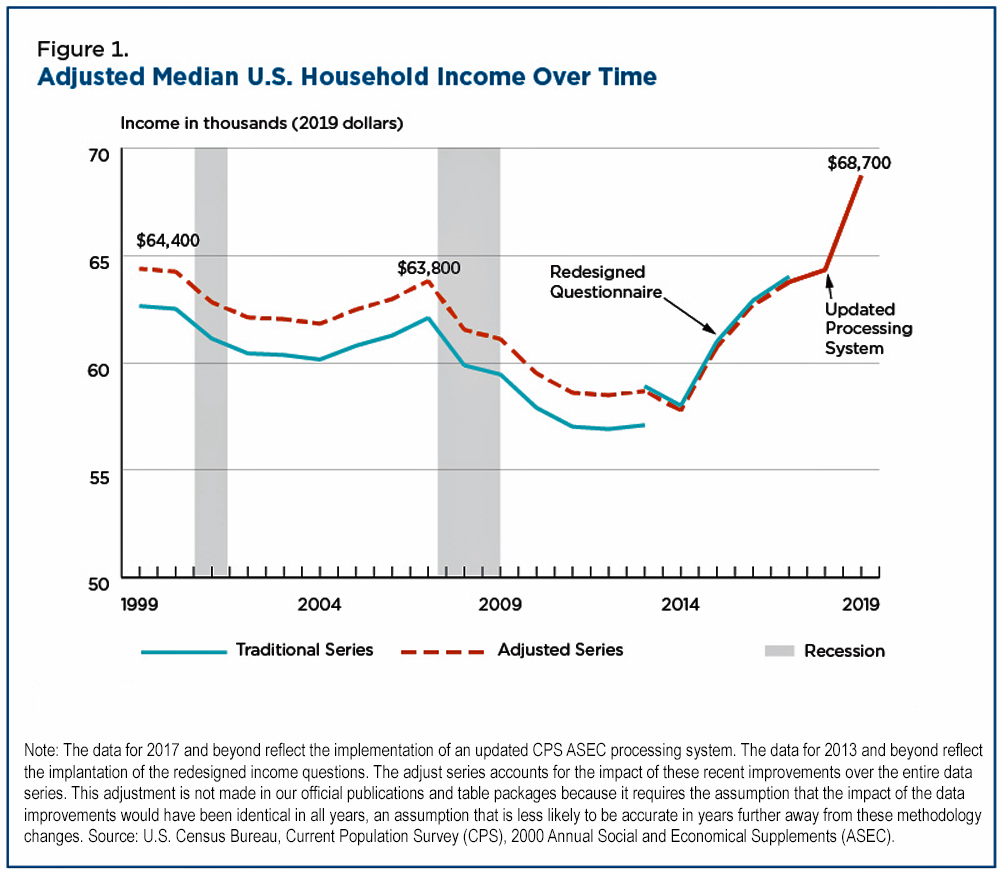
U.S. Census Bureau redesigned income questions in the 2014 CPS ASEC for the data year 2013 and updated the processing system in the 2019 CPS ASEC for the data year 2018.

That means some of the differences over time could be due to these recent survey improvements.
Changing Questions and Processing Systems
To understand differences in estimates related to the questionnaire change, the 2014 CPS ASEC used a split panel design that asked both traditional and redesigned income questions (see Appendix D of the 2014 Income and Poverty report for estimates).
Likewise, to understand the impact of the new processing system in the 2019 CPS ASEC, the Census Bureau re-released data from 2017, with one set of estimates reflecting the legacy processing system and one set based on the updated processing system (as discussed in working papers on income and poverty estimates).
These survey changes affected estimates of median household income and income and poverty estimates for some subgroups.
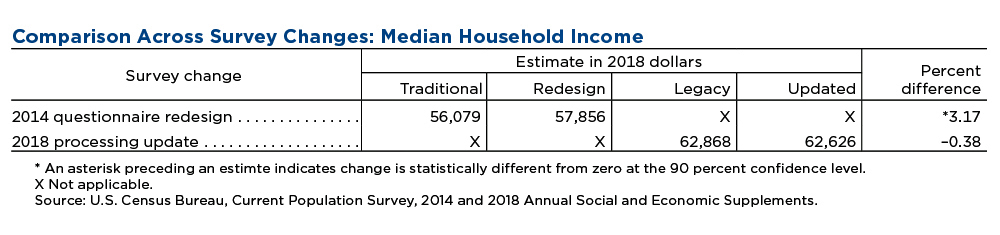
The table below shows the percentage difference in median household income for each change. The new questionnaire led to a 3.17% increase in median income, while the impact of the new processing system was not statistically significant.
.
What happens when changes are not taken into account?
Without adjusting for these changes, median household income was higher in 2019 than in any year since 1967, the first year the data are available.
.
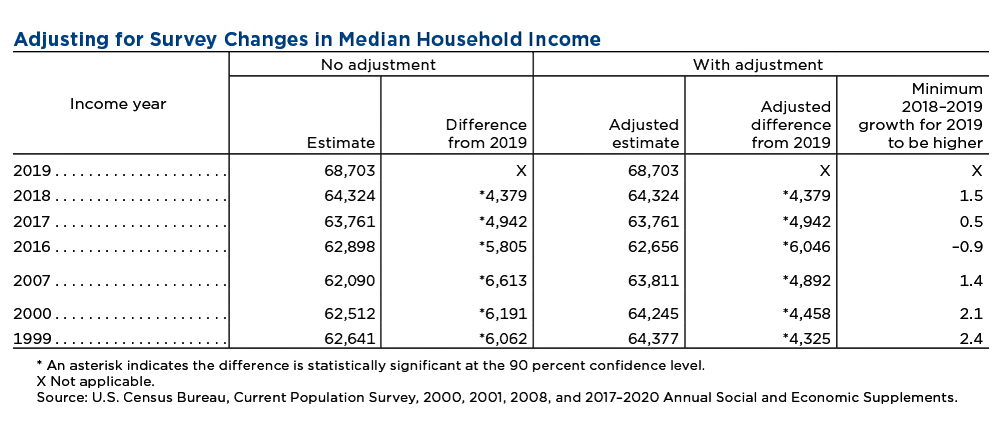
How They Make Comparisons Adjusted for Changes
One way to compare pre-improvement estimates to current data is by adjusting them up or down by the percentage difference of each improvement, as shown in the table below.
With or without the adjustment, income in 2019 was significantly higher than in all years shown and for every year since the data was collected.
.
.
How Did the Pandemic Impact Data Collection?
Given data-collection challenges during the pandemic, officials are concerned about bias in the 2019 estimate. So they had to ask how much income would have had to grow from 2018 for 2019 to lead to the highest ever income?
The answer: Income in 2019 would have to be 2.4% higher than in 2018.
The Census Bureau is currently researching the full impact of the pandemic and has tested various methods for adjusting for this bias (see the working paper).
While that work is ongoing, their current estimate is that income in 2019 was about 4.1% higher than in 2018, indicating median household income in 2019 was the highest on record.
.
Source: U.S. Census Bureau | Jonathan Rothbaum is chief of the Income Statistics Branch in the Social, Economic, and Housing Statistics Division.


