
H-E-B, Favor Office Space Voted Coolest In Austin
The Eastside Tech Hub, office space for Austin-based H-E-B Digital Partners as well as the headquarters for Favor, opened in June…
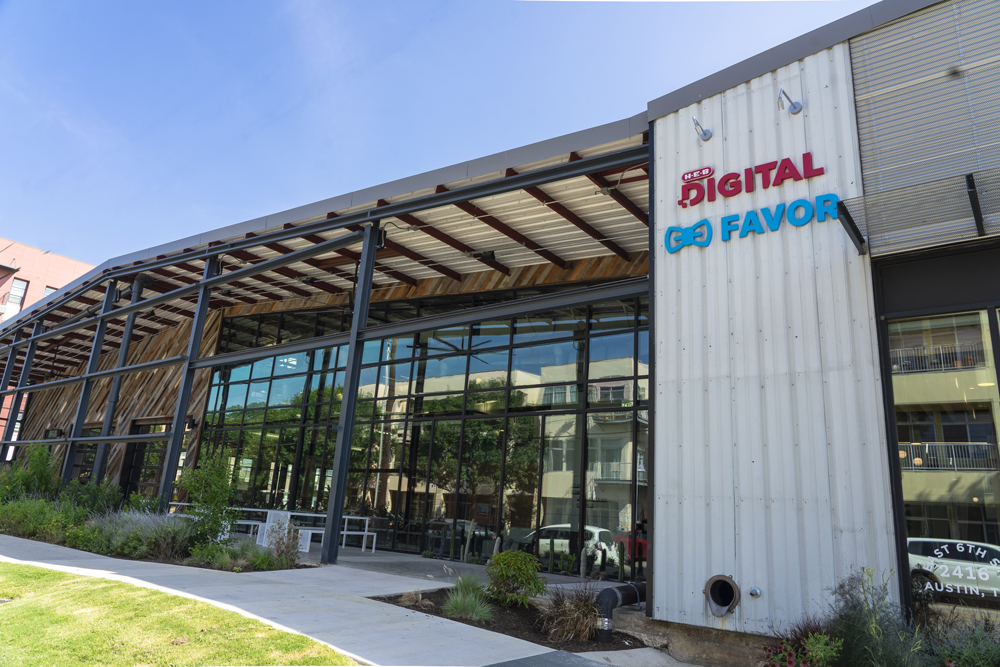
The Eastside Tech Hub, home to Austin-based H-E-B Digital Partners (employees) as well as the headquarters for Favor, took the top spot as coolest digs as part of the Austin Business Journal’s Second Annual Coolest Offices contest.
The two-story, open office concept offers a variety of dynamic work areas spread throughout the floor plan, including over 50 meeting rooms of varying sizes, equipped with advanced technology and video conferencing capabilities.
The workspace celebrates the unique identities of both H-E-B and Favor as well as thoughtfully integrates Texas throughout the interior design with native plants, furniture from Marfa and artwork from several Texas-based makers and artists.
The modern space also boasts amenities such as a coffee bar featuring local coffee roasters; lounge areas with couches and hammocks; video games and other recreational activities; amphitheater for events; and a wellness center featuring a rock-climbing wall, curated fitness classes, bike parking and showers.
Throughout the space are areas stocked with a variety of snacks, and fun gatherings and outings are regularly planned to encourage camaraderie.
The Austin office space is walking distance to several restaurants, coffee shops, breweries and the recently-renovated 7th Street H-E-B store.
Connecting its tech talent in Austin and San Antonio, the retailer provides shuttle rides between the two cities on Wi-Fi enabled buses throughout the work week.

As its tech team grows, H-E-B also announced plans earlier this year to open a state-of-the-art tech center at company’s San Antonio headquarters to house up to 1,000 H-E-B Partners.
Read more about the Eastside Tech Hub here. Career opportunities can be found on the H-E-B Careers and Favor websites.


