

Growth In Texas Manufacturing Activity Accelerates
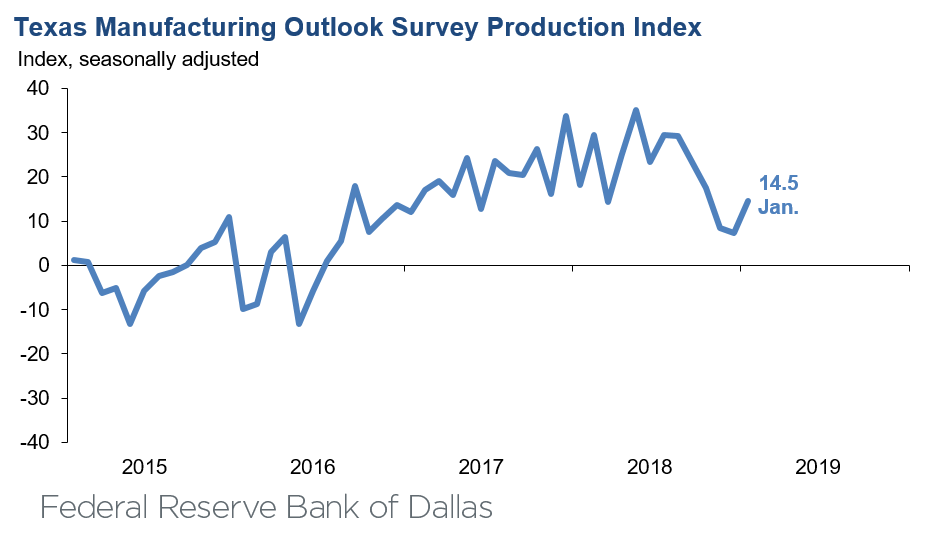
Texas factory activity continued to expand in January, according to business executives responding to the Texas Manufacturing Outlook Survey. The production index, a key measure of state manufacturing conditions, rose from 7.3 to 14.5, indicating an acceleration in output growth.
Other measures of manufacturing activity also suggested continued expansion in January, although the pace of demand growth slowed a bit. The capacity utilization index rose seven points to 14.8, and the shipments index rose five points to 11.4. Meanwhile, the new orders index edged down to 11.6 and the growth rate of new orders index fell from 5.8 to 1.2.
Perceptions of broader business conditions improved in January. The general business activity index rebounded from a multiyear low of -5.1 in December to 1.0 in January. This near-zero reading suggests manufacturers were fairly balanced in their assessment of whether activity had improved or worsened from last month. The company outlook index also rebounded from negative territory this month, rising more than 10 points to 7.1.
Labor market measures suggested slower growth in employment and workweek length in January. The employment index retreated four points to 6.6, a two-year low. Sixteen percent of firms noted net hiring, compared with 10 percent noting net layoffs. The hours worked index edged down to 3.6.
Upward pressure on input prices and wages eased further in January, while pressure on selling prices held steady. The raw materials price index slipped eight points to 21.2, and the wages and benefits index ticked down two points to 27.4. Meanwhile, the finished goods price index held steady at 6.4.
Expectations regarding future business conditions pushed further positive in January. The indexes of future general business activity and future company outlook rose to 11.7 and 22.3, respectively. Other indexes of future manufacturing activity also posted increases this month.
Data were collected Jan. 15–23, and 111 Texas manufacturers responded to the survey. The Dallas Fed conducts the Texas Manufacturing Outlook Survey monthly to obtain a timely assessment of the state’s factory activity.
Firms are asked whether output, employment, orders, prices and other indicators increased, decreased or remained unchanged over the previous month.

Survey responses are used to calculate an index for each indicator. Each index is calculated by subtracting the percentage of respondents reporting a decrease from the percentage reporting an increase.
When the share of firms reporting an increase exceeds the share reporting a decrease, the index will be greater than zero, suggesting the indicator has increased over the prior month.
If the share of firms reporting a decrease exceeds the share reporting an increase, the index will be below zero, suggesting the indicator has decreased over the prior month.
An index will be zero when the number of firms reporting an increase is equal to the number of firms reporting a decrease. Data have been seasonally adjusted as necessary.
January 28, 2019
January 28, 2019
Historical data are available from June 2004 to the most current release month.
| Business Indicators Relating to Facilities and Products in Texas – Current (versus previous month) | ||||||||
| Indicator | Jan Index | Dec Index | Change | Indicator Direction* | Trend** (Months) | % Reporting Increase | % Reporting No Change |
% Reporting Decrease |
| Production | 14.5 | 7.3 | +7.2 | Increasing | 31 | 33.4 | 47.7 | 18.9 |
| Capacity Utilization | 14.8 | 7.6 | +7.2 | Increasing | 31 | 31.9 | 51.0 | 17.1 |
| New Orders | 11.6 | 14.4 | –2.8 | Increasing | 27 | 33.2 | 45.1 | 21.6 |
| Growth Rate of Orders | 1.2 | 5.8 | –4.6 | Increasing | 25 | 24.9 | 51.4 | 23.7 |
| Unfilled Orders | 0.2 | –2.3 | +2.5 | Increasing | 1 | 13.6 | 73.0 | 13.4 |
| Shipments | 11.4 | 6.1 | +5.3 | Increasing | 26 | 31.0 | 49.4 | 19.6 |
| Delivery Time | –2.3 | –3.2 | +0.9 | Decreasing | 2 | 9.5 | 78.7 | 11.8 |
| Finished Goods Inventories | 5.4 | 1.9 | +3.5 | Increasing | 6 | 19.8 | 65.8 | 14.4 |
| Prices Paid for Raw Materials | 21.2 | 28.8 | –7.6 | Increasing | 35 | 32.1 | 57.0 | 10.9 |
| Prices Received for Finished Goods | 6.4 | 6.6 | –0.2 | Increasing | 30 | 14.9 | 76.6 | 8.5 |
| Wages and Benefits | 27.4 | 29.2 | –1.8 | Increasing | 114 | 28.9 | 69.6 | 1.5 |
| Employment | 6.6 | 11.0 | –4.4 | Increasing | 25 | 16.1 | 74.4 | 9.5 |
| Hours Worked | 3.6 | 5.0 | –1.4 | Increasing | 27 | 17.1 | 69.4 | 13.5 |
| Capital Expenditures | 16.0 | 14.2 | +1.8 | Increasing | 29 | 23.3 | 69.4 | 7.3 |
| General Business Conditions – Current (versus previous month) | ||||||||
| Indicator | Jan Index | Dec Index | Change | Indicator Direction* | Trend** (Months) | % Reporting Improved | % Reporting No Change |
% Reporting Worsened |
| Company Outlook | 7.1 | –3.4 | +10.5 | Improving | 1 | 23.1 | 60.9 | 16.0 |
| General Business Activity | 1.0 | –5.1 | +6.1 | Improving | 1 | 17.3 | 66.4 | 16.3 |
| Indicator | Jan Index | Dec Index | Change | Indicator Direction* | Trend** (Months) | % Reporting Increase | % Reporting No Change |
% Reporting Decrease |
| Outlook Uncertainty† | 15.6 | 9.2 | +6.4 | Increasing | 8 | 27.5 | 60.6 | 11.9 |
| Business Indicators Relating to Facilities and Products in Texas – Future (six months ahead) | ||||||||
| Indicator | Jan Index | Dec Index | Change | Indicator Direction | Trend* (Months) | % Reporting Increase | % Reporting No Change |
% Reporting Decrease |
| Production | 53.4 | 32.7 | +20.7 | Increasing | 119 | 58.3 | 36.8 | 4.9 |
| Capacity Utilization | 48.2 | 30.5 | +17.7 | Increasing | 119 | 53.1 | 42.0 | 4.9 |
| New Orders | 44.7 | 32.4 | +12.3 | Increasing | 119 | 52.3 | 40.1 | 7.6 |
| Growth Rate of Orders | 38.5 | 23.1 | +15.4 | Increasing | 119 | 46.0 | 46.5 | 7.5 |
| Unfilled Orders | 5.5 | 1.4 | +4.1 | Increasing | 40 | 19.1 | 67.3 | 13.6 |
| Shipments | 43.7 | 32.4 | +11.3 | Increasing | 119 | 51.4 | 40.9 | 7.7 |
| Delivery Time | 4.0 | 8.9 | –4.9 | Increasing | 26 | 13.1 | 77.8 | 9.1 |
| Finished Goods Inventories | 8.6 | 2.0 | +6.6 | Increasing | 15 | 19.2 | 70.2 | 10.6 |
| Prices Paid for Raw Materials | 31.8 | 34.3 | –2.5 | Increasing | 118 | 38.5 | 54.8 | 6.7 |
| Prices Received for Finished Goods | 26.7 | 26.7 | 0.0 | Increasing | 36 | 35.6 | 55.4 | 8.9 |
| Wages and Benefits | 47.7 | 45.0 | +2.7 | Increasing | 176 | 47.7 | 52.3 | 0.0 |
| Employment | 39.4 | 28.2 | +11.2 | Increasing | 74 | 45.4 | 48.6 | 6.0 |
| Hours Worked | 15.6 | 10.8 | +4.8 | Increasing | 32 | 23.0 | 69.6 | 7.4 |
| Capital Expenditures | 34.2 | 24.7 | +9.5 | Increasing | 110 | 40.9 | 52.4 | 6.7 |
| General Business Conditions – Future (six months ahead) | ||||||||
| Indicator | Jan Index | Dec Index | Change | Indicator Direction* | Trend** (Months) | % Reporting Increase | % Reporting No Change |
% Reporting Worsened |
| Company Outlook | 22.3 | 8.8 | +13.5 | Improving | 36 | 32.9 | 56.5 | 10.6 |
| General Business Activity | 11.7 | 3.2 | +8.5 | Improving | 32 | 26.8 | 58.1 | 15.1 |
*Indicator direction refers to this month’s index. If index is positive (negative), indicator is increasing (decreasing) or improving (worsening). If zero, indicator is unchanged.
**Number of months moving in current direction.
†Added to survey in January 2019.
Data have been seasonally adjusted as necessary, with the exception of the outlook uncertainty index, which does not yet have a sufficiently long time series to test for seasonality.
[divide icon_position=”left” width=”short” color=”#”]Source: Federal Reserve Bank of Dallas
Questions regarding the Texas Manufacturing Outlook Survey can be addressed to Emily Kerr at emily.kerr@dal.frb.org


