Texas Border Economy: June 2018 Summary
![]() Data revisions revealed a less optimistic outlook on the border as historically low unemployment failed to stimulate wages, primarily in Laredo and McAllen. Weakness in the value of the peso and…
Data revisions revealed a less optimistic outlook on the border as historically low unemployment failed to stimulate wages, primarily in Laredo and McAllen. Weakness in the value of the peso and…
![]()
Data revisions revealed a less optimistic outlook on the border as historically low unemployment failed to stimulate wages, primarily in Laredo and McAllen. Weakness in the value of the peso and heightened tension between the U.S. and Mexico contributed to the current conditions. The local economic struggles, however, did not hinder growth in the housing market. The El Paso and Brownsville business cycles marched forward but at different paces.
Due to the size of the El Paso economy, the rate of growth held a moderate yet stable trajectory that extended across industries. The West Texas metro also benefitted from housing affordability advantages compared with the rest of the state. Brownsville remained in higher-growth phase after stagnating last year. In general, the national and statewide economic expansions should stimulate activity in all of the border metros. Uncertainty regarding the North American Free Trade Agreement and potential cross-border supply-chain disruptions present the largest headwind to the border economies.
![]()
Economy
Economic activity was mixed along the border as indicated by movements in the Dallas Fed’s Business-Cycle Indices. Widespread labor-market improvements boosted the Brownsville economy 4.5 percent on a seasonally adjusted annualized rate (SAAR) after struggling through much of 2017. The El Paso business cycle extended its expansion at 1.4 percent growth, despite waning economic conditions south of the border.
In McAllen, data revisions revealed a nine-month business-cycle contraction despite historically low unemployment and upticks in retail activity. Sluggish wages and reduced nonresidential business investment hindered economic growth in the area. The Laredo economy suffered similarly, contracting 2.5 percent amid industry-wide employment losses and plummeting wages.
A flood of office and bank building investment in El Paso lifted total border construction values up 10 percent, providing temporary relief to the yearlong slide. Warehouse construction picked up in Brownsville and Laredo after a prolonged dry spell. On the residential side, single-family housing investment remained flat on the border, but El Paso’s burgeoning apartment market supported overall growth.
Border nonfarm employment decelerated to 1.9 percent SAAR growth, adding 2,900 jobs1 during the second quarter. Corrections in El Paso’s retail trade and professional/business services industry slowed annualized growth to 1.5 percent after a hot start to the year. Job losses spread across multiple industries in Laredo, stalling growth after brief signs of improvement.
The employment outlook was more favorable in the Rio Grande Valley, where McAllen maintained SAAR growth above two percent with 3,400 new jobs YTD, surpassing the 2017 total. Brownsville posted the highest growth rate at 3.3 percent as the manufacturing, professional/business services, and education/health services sectors continued to expand.
Manufacturing and maquiladora employment2 bounced back with more than 3,700 new jobs in June after a three-month stagnation. Reynosa and Chihuahua accounted for most of the rebound, adding YTD highs of 1,500 and 2,600 positions, respectively. Nuevo Laredo extended its steady upward trend, recovering all of last month’s losses. Employment growth patterns flattened in Matamoros but remained positive overall. In contrast, Juarez’s maquiladora employment contracted for the fourth consecutive month, shedding 3,800 jobs since January.
After rising in the first quarter due to the expanding labor force, unemployment rates1 along the border returned to historically low levels. Laredo’s unemployment rate held below 4 percent for the 11th consecutive month, while the El Paso rate balanced at 4.3 percent. Unemployment remained elevated in the Rio Grande Valley at 6.4 and 6.7 percent in Brownsville and McAllen, respectively, but remained well below year-ago levels.
Real private hourly earnings, however, continued to suffer along the border. El Paso paid the highest wages at an average of $18.55 per hour (before adjusting for inflation) but remained $7 below the statewide level. McAllen’s earnings flattened just below the El Paso average at $18.33 per hour.
After a brief pause last month, Laredo’s wage slide continued, sinking below $16.50 per hour for the first time in nearly three years. Brownsville was the bright spot, where inflation-adjusted earnings jumped 7.3 percent YTD—a much needed yet minor improvement relative to the 20.5 percent decline between 2012 and 2017.
In the currency market, the peso-per-dollar exchange rate1 rose to a 16-month high of 20.29 but was relatively unchanged after accounting for inflation. The total value of trade passing through the Texas border metros flattened as imports stepped back in El Paso and McAllen. Export growth offset the slip, led by El Paso’s $98 million monthly increase. Overall, Laredo remained the major trade hub on the border, accounting for 63 percent of total trade flows in June.
![]()
Housing
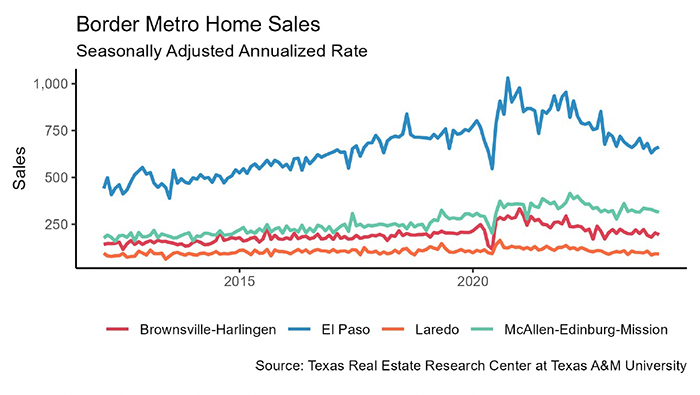
Border housing sales inched forward on a four-month positive trend. Healthy economic conditions in Brownsville and El Paso elevated sales volumes, reaching 7.1 and 3.5 percent growth YTD after a sluggish first quarter.
Despite labor-market woes, sales in Laredo jumped 10.6 percent YTD but remained below last year’s plateau. The rebound occurred primarily for homes priced above $200,000, which accounted for more than a third of transactions through the local MLS. In McAllen, sales activity flattened on the year after a minor uptick in May.
The number of single-family housing construction permits issued in the border metros rose to 572 after a three-month contraction. El Paso permits stabilized at 150 after reaching a 14-year low in May.
Permits slowed for the third consecutive month in Brownsville but maintained positive growth on the year. On the other hand, McAllen led the border with 262 monthly permits issued, up 14 percent YTD. Activity also picked up in Laredo with an annual high of 94 monthly permits.
Private single-family construction values rose half a percent and built up positive momentum. The influx of permits in Laredo and McAllen resulted in a 12 percent YTD increase in single-family construction values.
Brownsville’s first quarter surge in values extended through June, pushing YTD growth above 22 percent, but the rate of increase moderated. In El Paso, values stabilized with permit activity but lagged the other border metros.
The supply of active listings for homes sold through an MLS varied along the border. The total months of inventory (MOI) dropped to a record low 4.5 months in El Paso amid a sharp drop in homes listed below $200,000. Strong sales in Brownsville also chipped away at active listings, thereby closing the supply gap in the Rio Grande Valley.
The MOI fell to 8.8 months in Brownsville, while holding at 8.4 months in McAllen. Laredo maintained low inventory levels at 5.2 months but exhibited upward pressure as the pace of single-family construction accelerated.
On the demand side, Laredo maintained the lowest average number of days on market (DOM) at 61 days. The DOM trended upward in Brownsville and El Paso, reaching 127 and 98 days, respectively, as demand shifted toward higher price cohorts where homes typically take longer to sell. In McAllen, the DOM leveled out around 101 days, slightly below its long-run average of 107.
Housing price pressures eased along the border. Inventory upticks pulled Laredo’s median sale price below $160,000 for the first time this year. The median price dipped $3,200 in Brownsville and McAllen, settling at $142,770 and $145,320, respectively. El Paso was the exception, where an increased appetite for homes priced above $300,000 pushed the median to a record high $153,560.
Stagnant incomes, however, offset price moderation and challenged housing affordability on the border. The Texas Affordability Index approached decade lows in the Rio Grande Valley and Laredo.
The Brownsville and McAllen indices fell below 1.4, suggesting that families earning the median income in the region could no longer afford homes priced 40 percent above the median sale price. These indices peaked above 2.1 in 2013. Housing affordability was even worse in Laredo, where the index approached 1.3. The El Paso index fell below 1.7 but remained well above the state average of 1.45.
_______________
1 Monthly numbers are reported instead of a three-month moving average for consistency.
2 Mexican manufacturing and maquiladora employment is generated by the Instituto Nacional de Estadística y Geografiía. Its release typically lags the Texas Border Economy by one month. Monthly numbers are reported instead of a three-month moving average for consistency.


By, James P. Gaines, Luis B. Torres, Wesley Miller, and Paige Woodson
This story was originally published by Real Estate Online, a Texas A&M publication.


