

Texas Economy: Energy Sector Indicators
Energy Indicators
Crude oil prices rebounded somewhat in January from end-of-year levels, but the rig count slipped on earlier price declines. Pipeline construction has driven substantial job growth in Texas and remains a key factor in Permian economics.
Mining job growth picked up at the end of 2018. U.S.–Venezuela trade in crude oil and products may be impacted negatively by recent sanctions imposed by the United States.
Prices
Crude prices recovered somewhat in January from December lows (Chart 1). The price of international benchmark Brent crude averaged $60 a barrel in January, while West Texas Intermediate (WTI) priced in Cushing averaged $51.
The average price of WTI–Midland bounced from $44 in December to $48 in January.
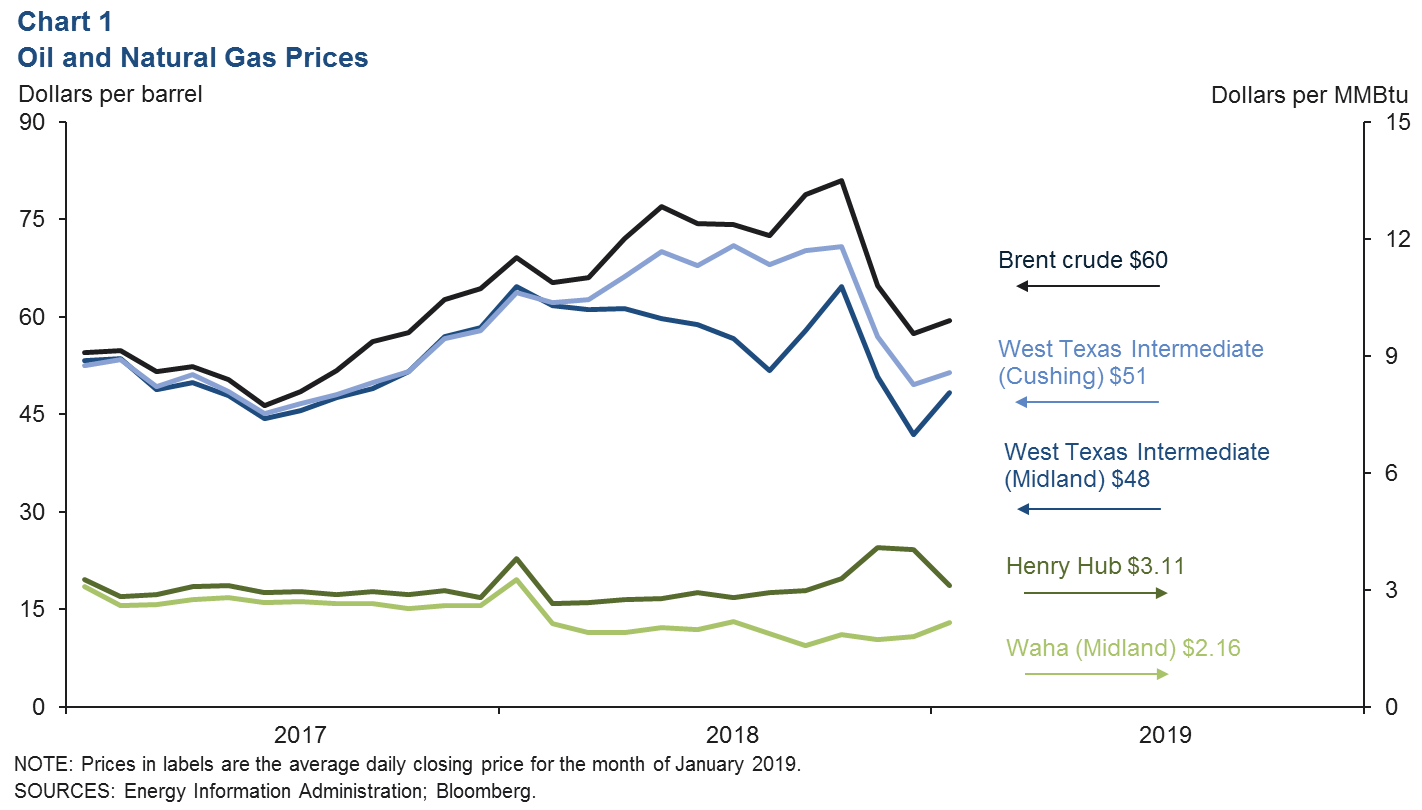
The Midland-to-Cushing price spread averaged over $16 in August and September 2018 but evaporated by the end of January. Spreads to the Texas coast (Louisiana Light Sweet and Magellan East Houston) similarly fell from about $20 to just under $6 over that time.

The narrowing spreads were due in part to new pipeline capacity.
Henry Hub natural gas prices averaged $3.11 in January, down from about $4 the month before.
Winter weather and the polar vortex gave natural gas spot market prices a moderate boost in daily trading in January; however, modest declines in weekly stocks (increases on a seasonally adjusted basis) in the eastern, midwestern and southern regions of the U.S. helped keep downward pressure on prices.
Waha natural gas priced in West Texas rose to an average of $2.16 in January, still well below Henry Hub, as pipeline constraints limited the prices producers could receive, incentivizing substantial flaring in the region as production grew.
Permian Takeaway Capacity
The local discounts on crude and natural gas in West Texas have declined considerably thanks to new pipeline capacity. However, the region may find itself short on pipelines again in mid-2019, based on modest production growth assumptions for the basin (Chart 2).
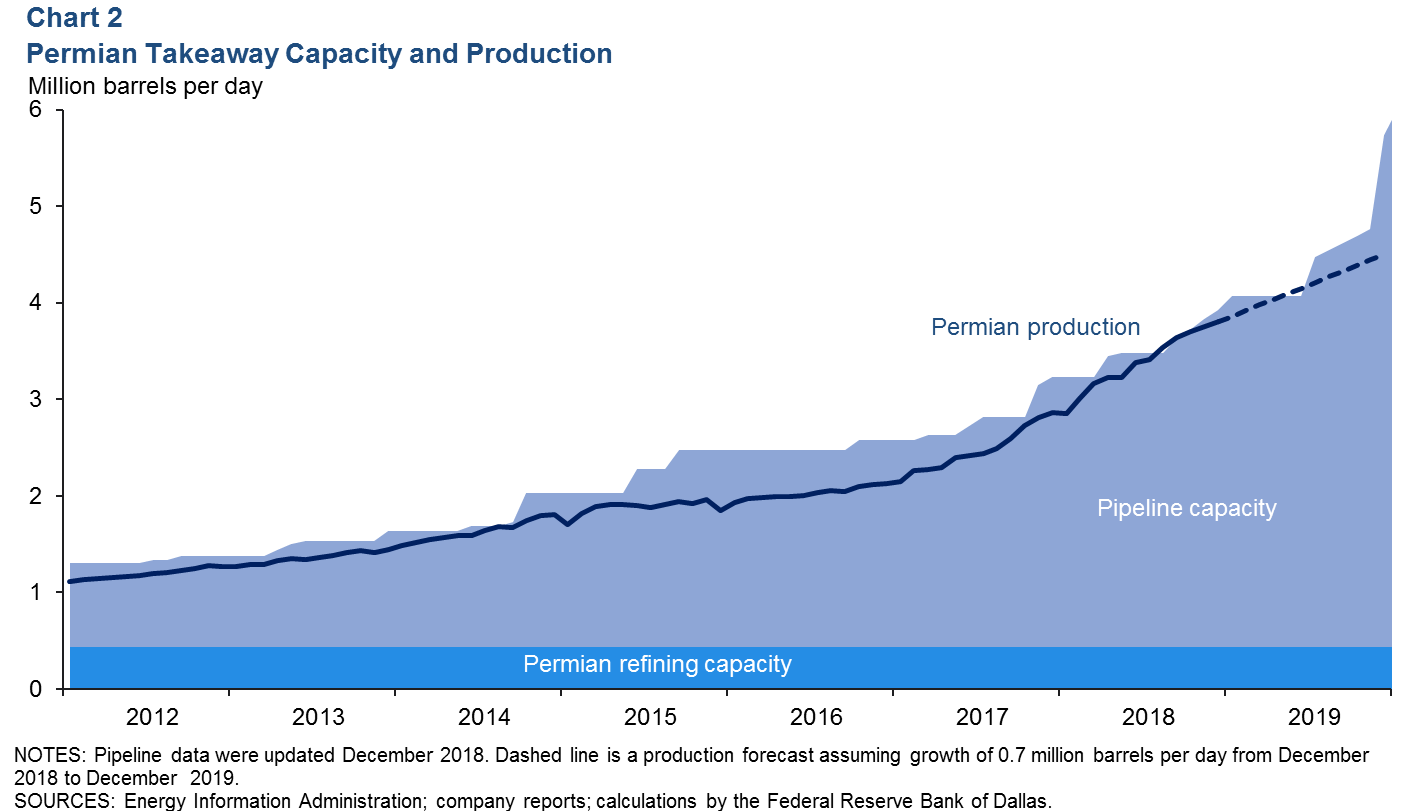
Ports, chemical plants and refineries are also building infrastructure along the coast to move record-breaking volumes of hydrocarbons and related products to global markets.
The frenzied pace of construction is evident in oil and gas pipeline construction jobs; these accounted for 34 percent of all construction job growth in Texas from the first half of 2017 to the first half of 2018—about 9,056 jobs—according to the Quarterly Census of Employment and Wages.
Uncompleted Wells
Amid a backdrop of falling oil prices, the inventory of drilled but uncompleted wells surged in December (Chart 3). Inventories in the Permian rose to 10 months (4,048 wells), as the number of wells completed slipped to 396, according to the Energy Information Administration’s January Drilling Productivity Report. At that rate, it would take nearly 4.5 months to complete just the 1,764 wells added to Permian inventories during 2018.
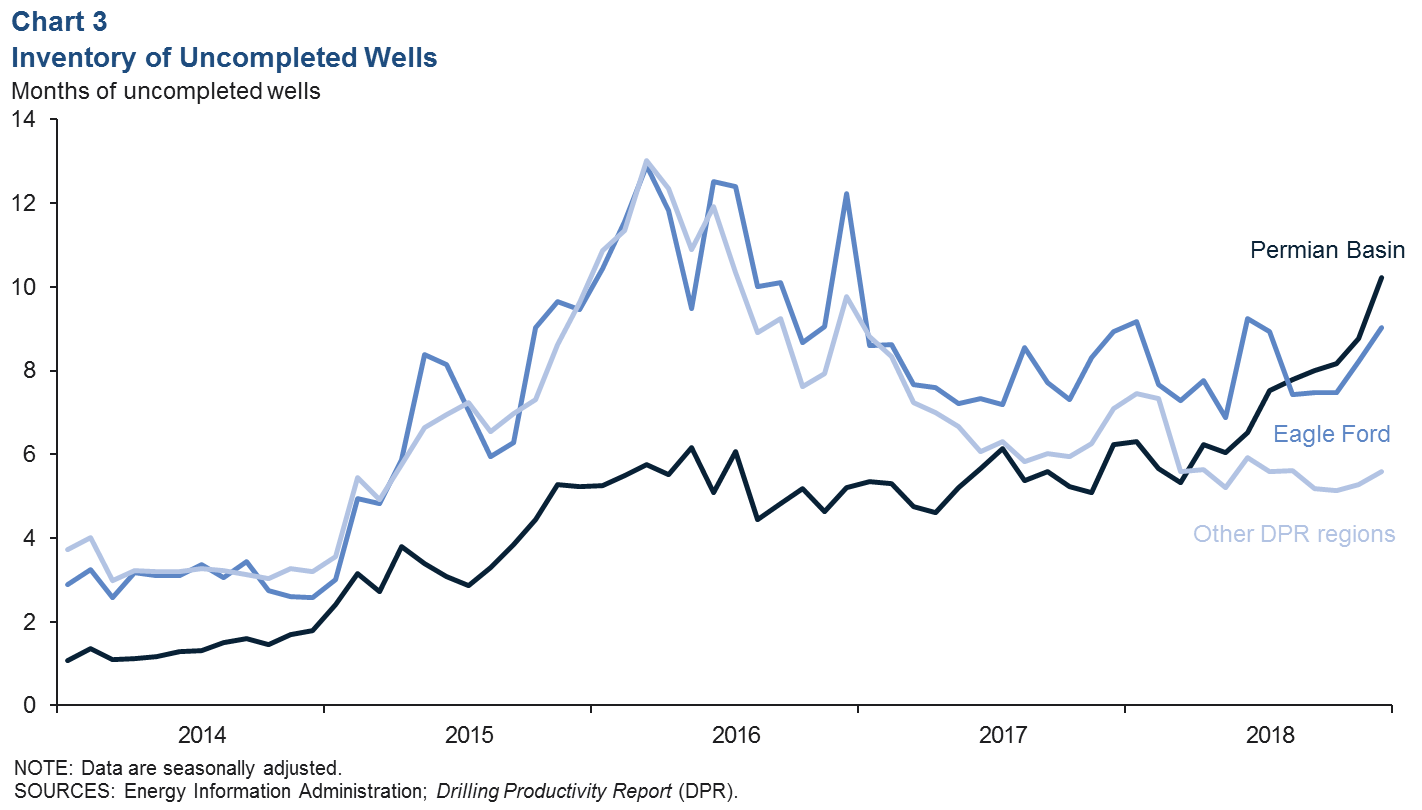
The months of inventory outside the Permian had been flat-to-down for much of 2018 but rose in the Eagle Ford and elsewhere to nine months and six months in December, respectively. This is in the range these inventories have fluctuated within over the past two years.
Drilling Activity
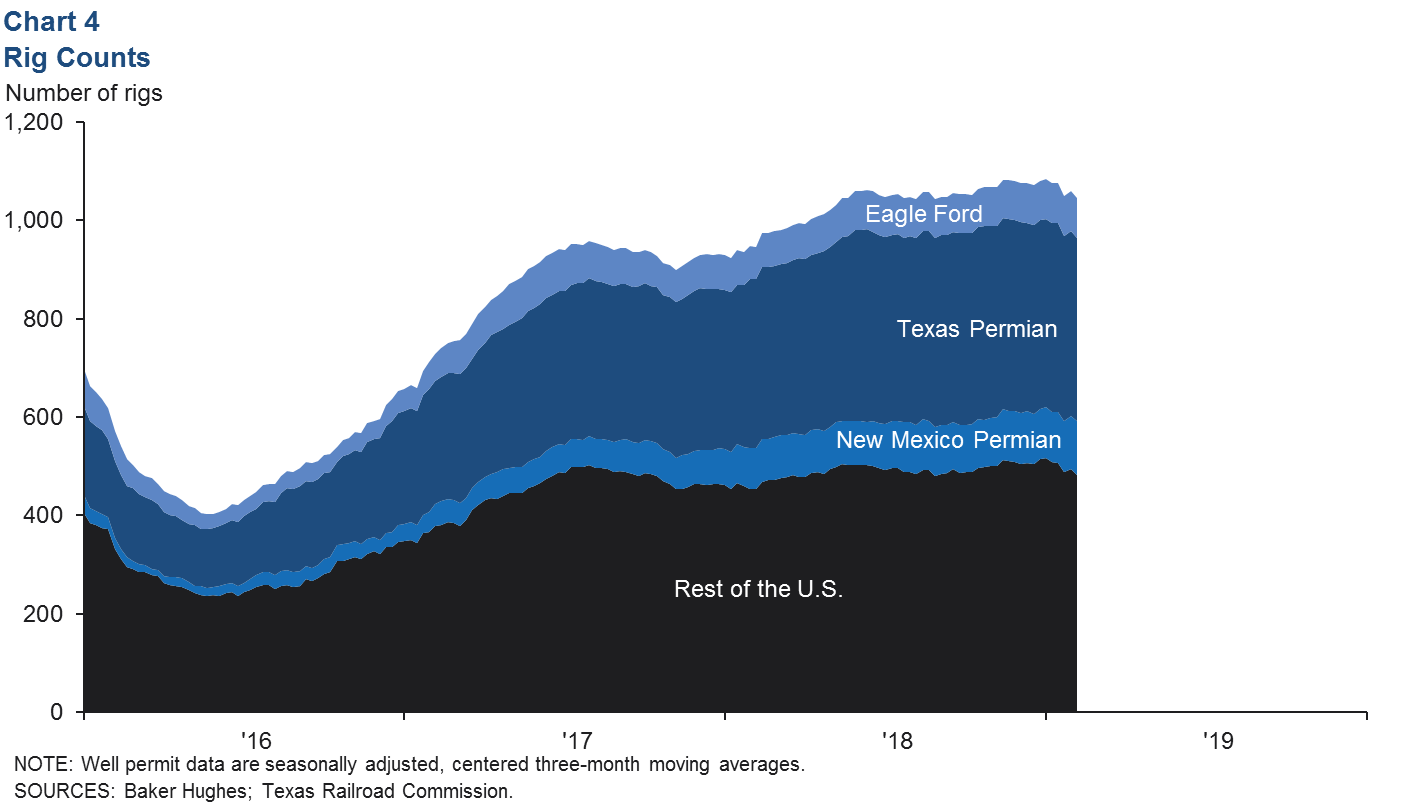
The U.S. rig count was flat on average in December at 1,077 despite modest downward seasonal pressure, but weekly data for January saw drilling decline (Chart 4).
Drilling in the Permian Basin fell to 481, as a dip of 11 rigs on the Texas side of the basin was partially offset by increased drilling on the New Mexico side.
Drilling in the Eagle Ford stayed flat near 81 rigs. Drilling in the rest of the U.S. saw more-pronounced declines, with the number of rigs dropping from a high of 517 at the end of December to 483 at the end of January.
Employment
Initial estimates for mining employment growth in Texas (excluding Houston) accelerated from an annual 6.4 percent for the three months ending in September 2018 to 10.9 percent for the three months ending in December—or 4,100 jobs (Chart 5).
Although growth in the Houston metropolitan area didn’t keep pace with the state, it still accelerated from 3.8 percent to 8.7 percent—1,600 jobs.
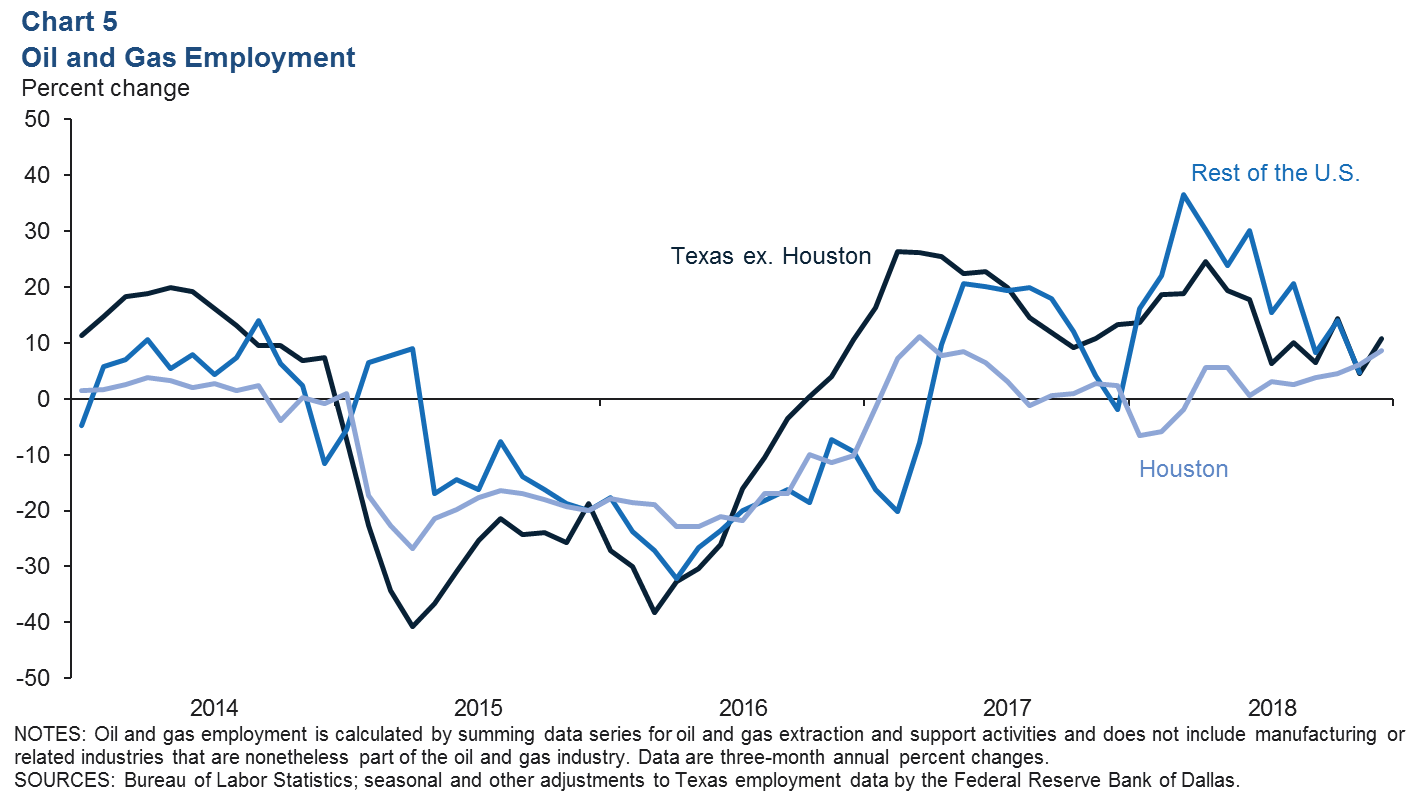
Statewide, support activities for mining (5,500 jobs; mostly oilfield services firms) led job growth September to December, and extraction (mostly exploration and production firms) flipped from a 5 percent annual decline over the three months ending in September to a 1 percent annual gain through the remainder of 2018. This is the first three-month increase in extraction since May.
Extraction jobs outside of Texas accelerated from 3.4 percent in September to 11.2 percent in December. Support activities job estimates for the rest of the U.S. are available with a lag, but growth slowed for the three months ending in November.
U.S.–Venezuela Energy Trade
Crude oil imports from Venezuela to the United States have been on a steady downward trend for several years, as Venezuela’s production capacity eroded (Chart 6).
Imports fell in particular in 2017, before rebounding to over 530 million barrels per day in the second half of 2018.
The makeup of Venezuelan crude makes it challenging to refine, and the U.S. Gulf Coast is one of the few places sophisticated enough to process it.
As Venezuelan heavy-crude imports to the U.S. have slipped, refiners have been able to source increasing volumes of heavy Canadian crude. The U.S. does not export crude to Venezuela but does export products.
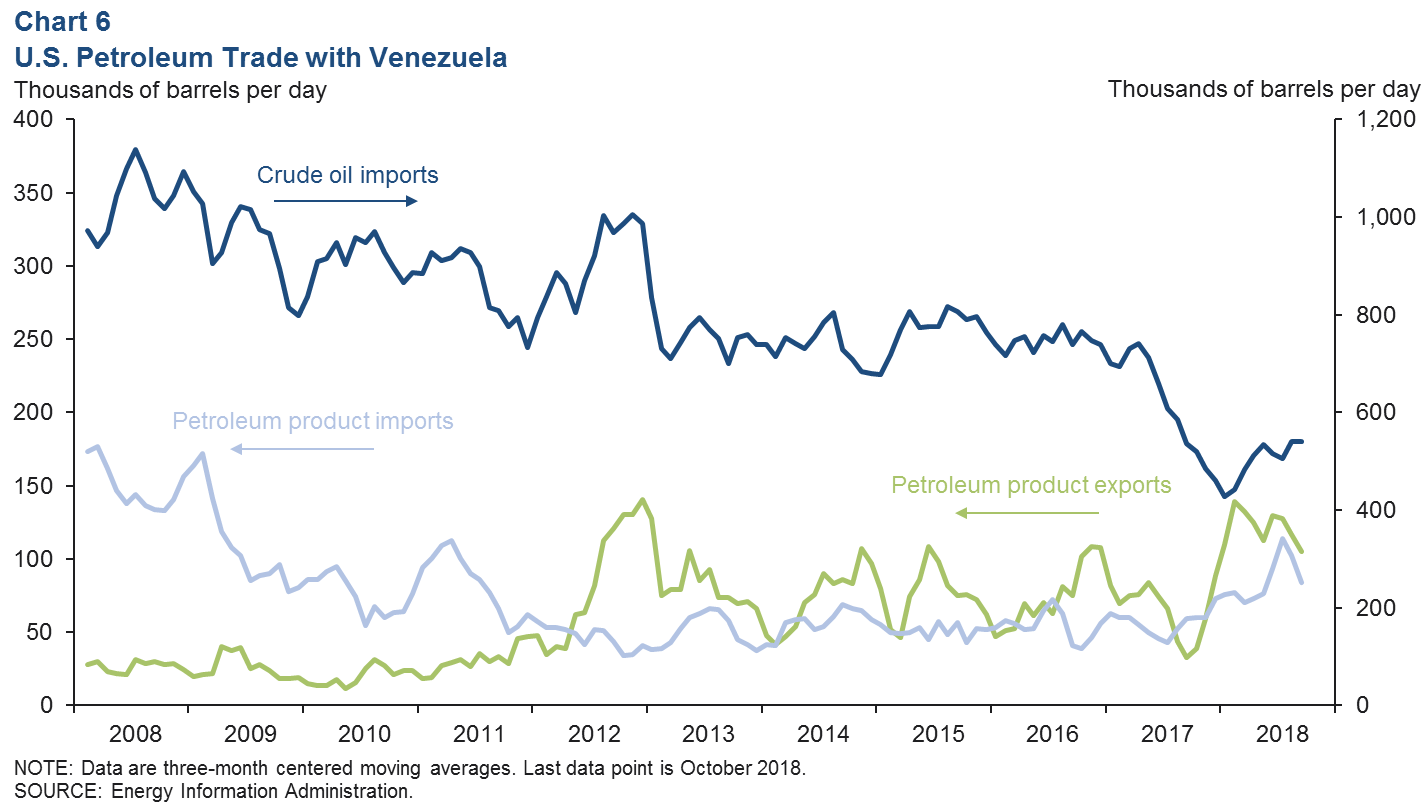
The U.S. exported an average of about 121,000 barrels per day (b/d) of various products to Venezuela through October 2018. “Unfinished oils” (or heavy naphthas) were a large share of those exports and are used to “dilute” thick Venezuelan crude for transport and processing.
The U.S. also exports distillates and gasoline-blending components. On the import side, the U.S. brought in about 83,000 b/d of product from Venezuela last year, mostly high-sulfur fuel oils—typically used as marine fuel or “bunker fuel”—and some gasoline-blending components.
Recent political tensions between the U.S. and Venezuela escalated as the U.S. imposed sanctions on the national oil company Petróleos de Venezuela, SA (PDVSA) on Jan. 28, 2019, in protest of the apparent re-election of Venezuelan President Nicolás Maduro.
The sanctions are creating uncertainty surrounding the extent to which physical trade will be disrupted and over what time frame.
Permian Basin Economic Indicators
In 2018, Permian Basin employment grew 7.5 percent, well above Texas’ job growth of 2.4 percent.
However, area job growth fell in the last quarter, and the unemployment rate inched up to 2.5 percent. Oil production remains strong, but the rig count was flat. Housing measures continue to show strength.
Labor Market
Employment Expands in December
Permian Basin employment grew at annualized rate of 9.5 percent in December (Chart 1), up from the 8.3 percent decline in November. Payrolls dipped in the fourth quarter after posting a solid gain of 10.2 percent in the first nine months of 2018.
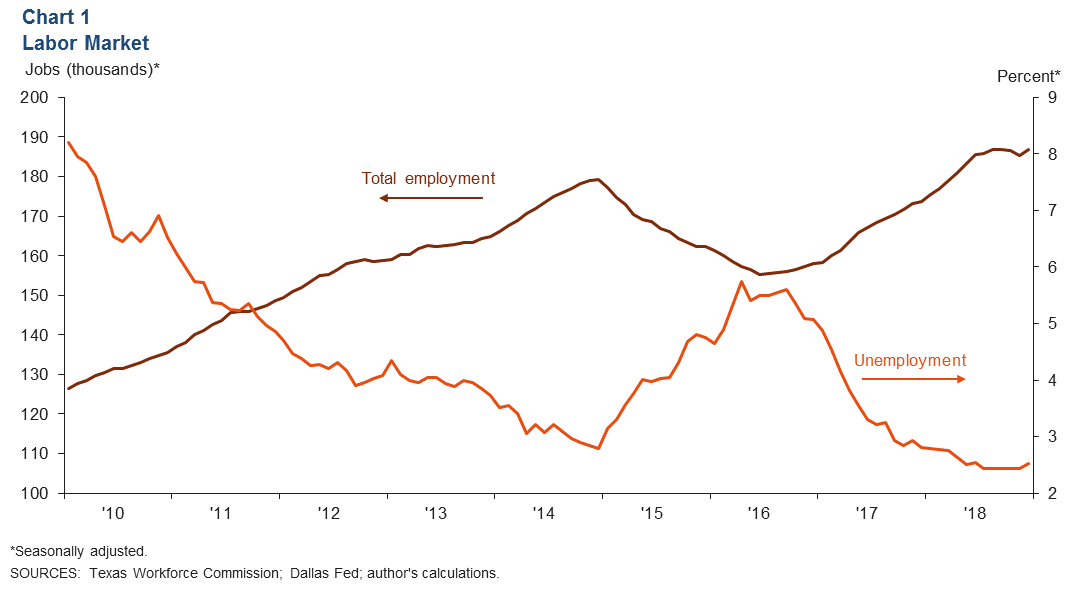
Despite the December job gains, the jobless rate inched up to 2.5 percent. The rate remained well below the Texas average of 3.7 percent.
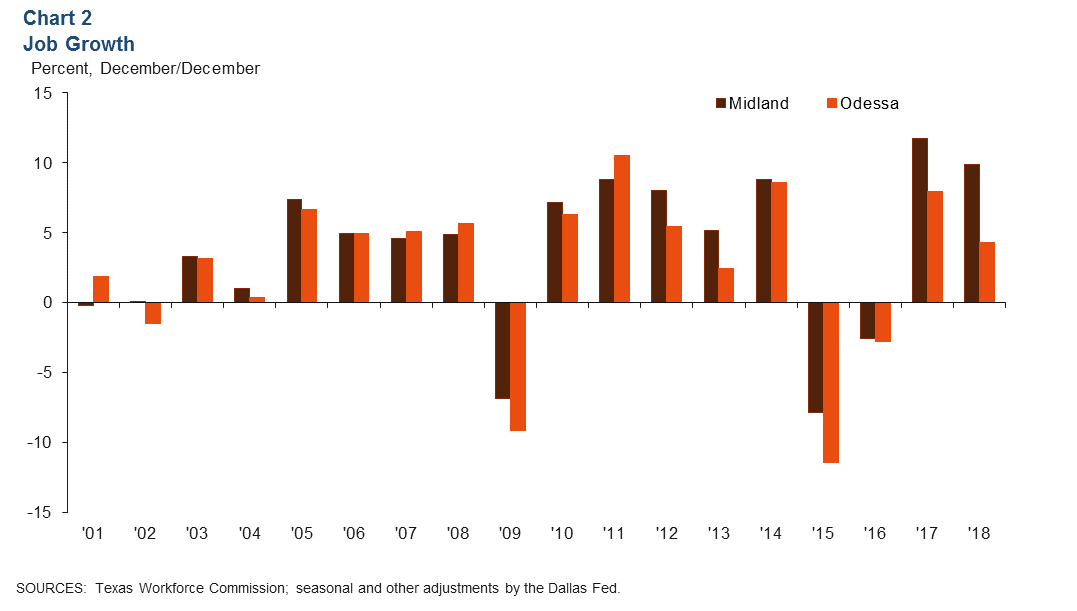
Midland Outpaces Odessa in Job Growth
In 2018, employment expanded 9.9 percent in Midland, compared with 4.3 percent in Odessa (Chart 2).
This marked the second consecutive year in which Midland’s employment gains outpaced Odessa’s. Both metros outpaced the state’s 2.4 percent growth. Midland created approximately 9,700 jobs last year, compared with 3, 200 in Odessa.
Energy
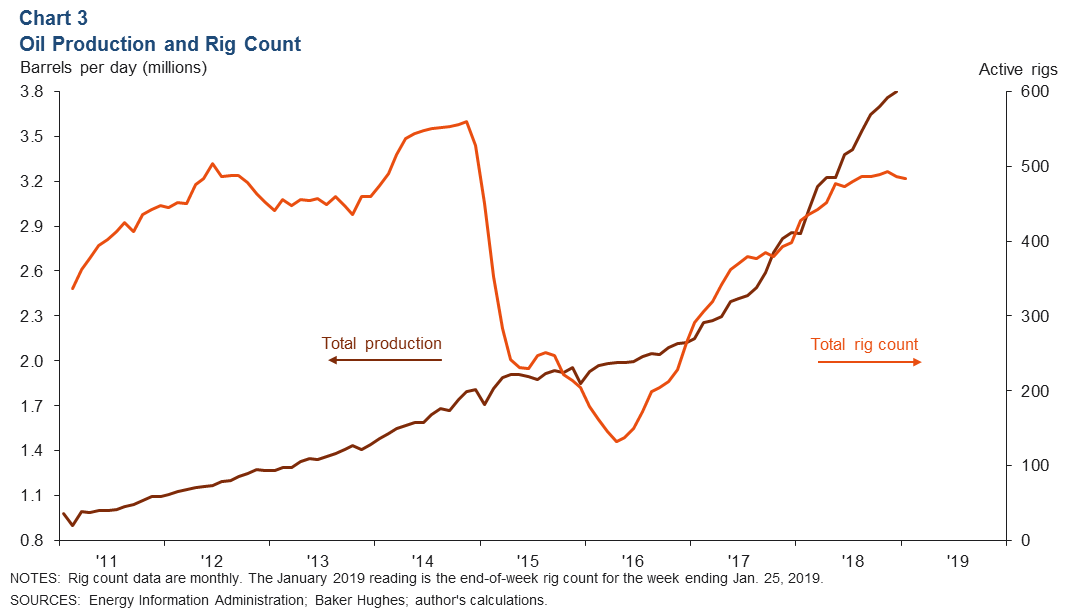
Oil Production Climbs; Rig Count Still Subdued
Permian Basin oil production is estimated to have reached 3.8 million barrels per day (b/d) in December, up from November’s 3.76 million b/d (Chart 3). Meanwhile, the Permian Basin rig count was little changed at 484 in January.
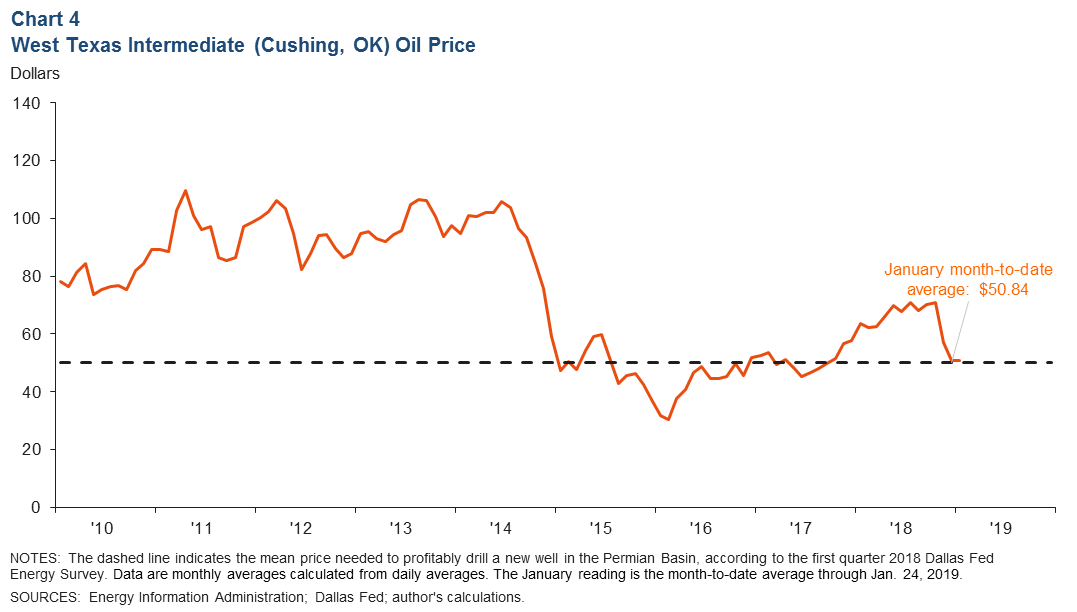
West Texas Intermediate Oil Price Drops
After peaking in October near $76, the West Texas Intermediate (WTI) oil price has fallen. WTI this month has averaged $50.84 through Jan. 24 (Chart 4). According to the latest Dallas Fed Energy Survey, respondents expect prices to finish 2019 near $59.97 per barrel.
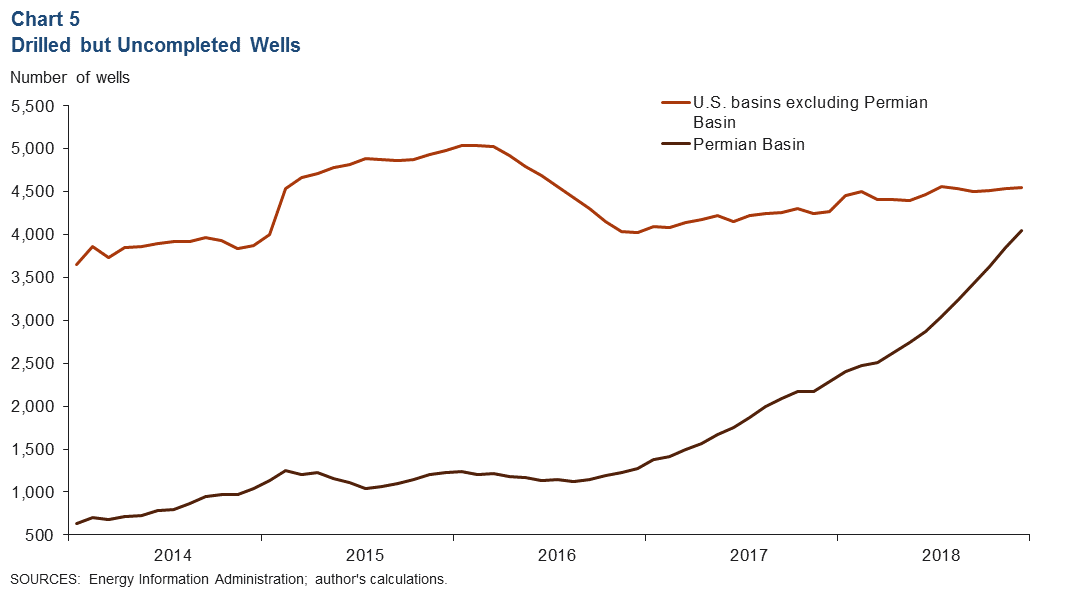
Drilled but Uncompleted Wells Rise Steadily
The Permian Basin had over 4,000 drilled but uncompleted wells (DUCs) in December, up 5.3 percent from November (Chart 5). DUCs outside of the Permian continued to increase at a much slower pace. The Permian now accounts for just under half of all DUCs in the U.S.
Housing
Existing-home sales reached new highs in 2018. Sales in the Permian Basin totaled 4,521, up more than 10 percent from 4,100 in 2017 (Chart 6). The average price also continued to climb, rising 6.3 percent over the year to $282,913.
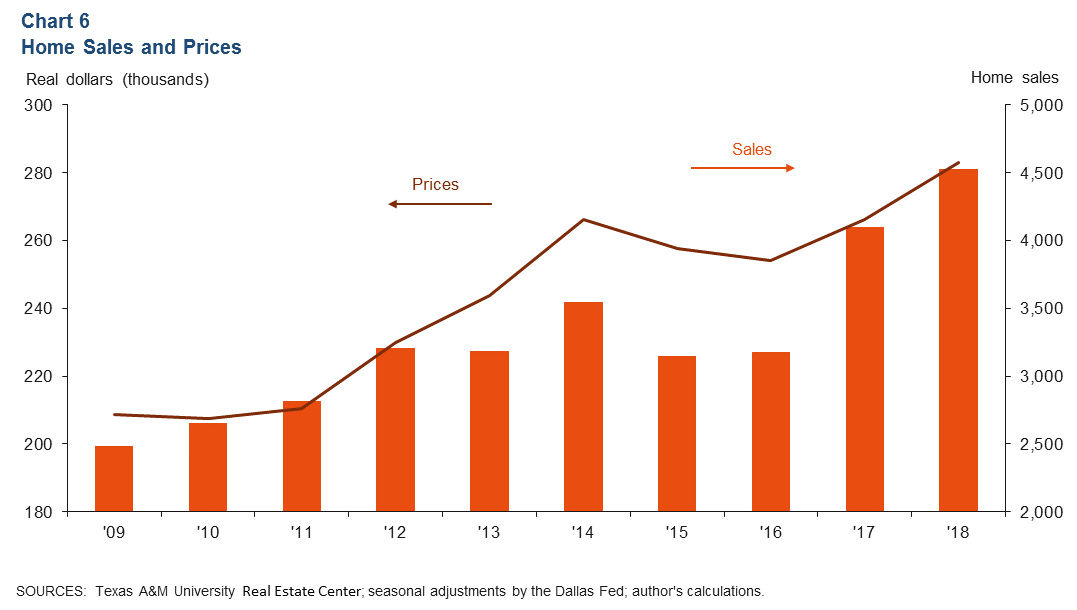
With robust sales, inventories remain tight in the Permian region. In December, inventories stood at 1.6 months in Midland and 1.3 months in Odessa.
NOTES: Data are for the Midland–Odessa metropolitan statistical area (Martin, Midland and Ector counties), except for energy data, which cover the 55 counties in West Texas and southern New Mexico that make up the Permian Basin region. Data may not match previously published numbers due to revisions.
[divide icon_position=”left” width=”short” color=”#”]Source: Federal Reserve Bank of Dallas


