
Texas Housing Insight: February 2018
![]() Supply-side obstacles menaced the Texas housing market as homebuilders, faced with rising input and labor costs, failed to keep pace with the state’s economic and population growth…
Supply-side obstacles menaced the Texas housing market as homebuilders, faced with rising input and labor costs, failed to keep pace with the state’s economic and population growth…
Inventory relief in the new-home market vanished, dragging the Texas months of inventory to a 28-year low of 3.4 months. Single-family supply indicators remained stable at an aggregate level but are not satisfying the current rate of household formation in Texas.
The challenge remains not only for developers to expand the housing stock but to do so especially at the lower end of the market.
Supply*
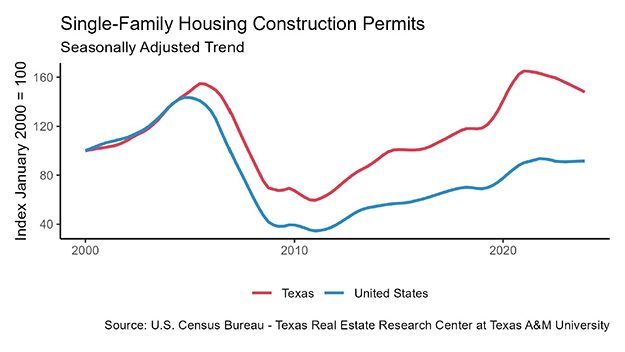
The Texas Residential Construction Cycle (Coincident) Index, which measures current construction activity, inched forward as industry employment and wage growth offset rising interest rates.
A monthly slowdown in weighted building permits and housing starts flattened the Texas Residential Construction Leading Index (RCLI), signaling supply-side challenges as the year progresses.

The number of statewide monthly single-family housing construction permits (unweighted) ticked down 2.6 percent but maintained upward momentum. Texas led the U.S. in permits issued and accounted for more than 17 percent of the national total.
Houston remained the national metropolitan leader, issuing 3,363 nonseasonally adjusted monthly permits, followed by Dallas-Fort Worth (DFW) at 2,897.
Data revisions corrected Fort Worth’s January boom down from 60.3 to 50.3 percent, but levels stayed elevated this month. Austin permits ticked down to 1,186 but moved from eighth to sixth in the national ranking.
In contrast, the trend deepened in San Antonio (545) as permits slid 25.5 percent since September 2017. Despite leading the nation in single-family housing construction, additional growth is warranted as statewide permits per capita remained more than 36 percent below 2006 levels.
Texas housing starts dropped 12 percent, retracting all of last month’s double-digit growth.
Slowed multifamily construction accounted for most of the monthly flop. Aside from cyclical volatility, the trend for total housing starts flattened in 2014 and has failed to sustain several growth spurts.
After accounting for the state’s population increases, the outlook worsens as per capita starts remained 39.5 percent below pre-recessionary levels.
Single-family private construction values followed housing starts down 18.3 percent, slipping to the lowest level since July 2016. Declines were widespread across the state.
After solid gains in January, DFW and San Antonio recorded 15.6 and 22.0 percent contractions, respectively. Single-family construction values extended a six-month slide in Austin, falling 25.5 percent since August 2017.
Houston fared better amid rebuilding efforts after last year’s hurricane but still posted a 7.8 percent contraction.
The Texas months of inventory (MOI) sunk below 3.4 months, its lowest point in the series’ 28-year history. Around six months of inventory is considered a balanced housing market.
Both new- and existing-home MOI reached record lows at 4.4 and 3.1 months, respectively. Supply conditions worsened across the price spectrum, but major shortages persisted for homes priced below $300,000, where the MOI slid to 2.7 months.
This ultra-constrained price range accounted for more than 70 percent of homes sold through Multiple Listing Services (MLS), affecting more than the stereotypically strained demographics (e.g. first-time homebuyers and millennials).
Supply conditions suffered similarly in the major metros as population growth stressed housing construction capacity. North Texas observed the tightest supply as the MOI fell below 2.3 and 2.0 months in Dallas and Fort Worth, respectively.
With resale inventories near their lower limit, the downward pressure stemmed primarily in the new-home market where the supply of listings collapsed by more than 15 percent year over year (YOY).
In San Antonio, 17 straight year-over-year declines in the supply of new-home listings pulled the total MOI below 3.3 months. Last year’s inventory improvements in Austin dissipated as the MOI receded below 2.4 months. Houston was the only major market with MOI above the state level, settling around 3.5 months.
Demand
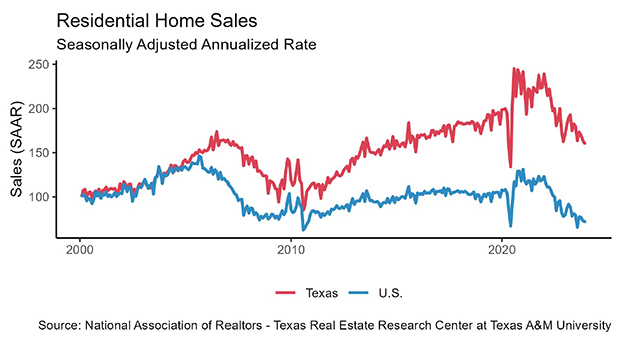
Seasonally adjusted housing sales fell 0.9 percent, dampened by decreased activity in the new-home market. Shortages of homes priced less than $300,000 continued to hinder growth.
In Dallas and San Antonio, total housing sales fell 2.1 and 5.0 percent, respectively, but maintained upward trends.
Sales volumes flattened in Austin and Fort Worth, mirroring the statewide movement, while Houston sales remained elevated 39 percent since Hurricane Harvey.
Despite sluggish sales, Texas housing demand was strong as the average days on market (DOM) fell below two months.
Homes priced between $200,000 and $300,000 sold rapidly, averaging 54 days on the market, while homes priced below $200,000 averaged 59 days. In general, demand levels by price cohort have plateaued under the current market conditions, maintaining a flat trend since 2015.
North Texas maintained fierce demand, where homes averaged just 42 and 38 days on the market in Dallas and Fort Worth, respectively.
Homes in Austin and San Antonio averaged 58 and 60 days, up 9.4 and 9.5 percent YOY, respectively. Houston homes also averaged 57 days on the market but exhibited downward pressure amid steady sales.
Interest rates surged amid increased fiscal spending and economic growth, prompting concerns that the Fed could accelerate the pace of federal funds rate hikes.
The ten-year U.S. Treasury bond yield rose 28 basis points to 2.86 percent, the highest since January 2014. A similar 30-basis-point increase pushed the Federal Home Loan Mortgage Corporation 30-year fixed-rate above 4.3 percent.
In Texas, the rising rate lifted annual mortgage payments nearly $400 on the median home, adding an additional $11,655 over a 30-year term.
Mortgage financing obstacles, combined with an $11,000 YOY sale price increase, struck a blow to waning housing affordability.
Prices
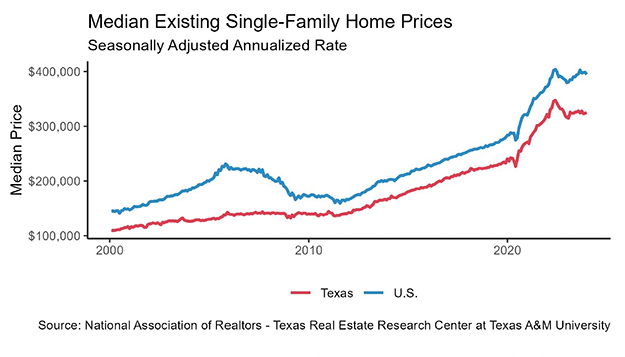
The Texas median home price held firm at $231,414, a 5.1 percent increase YOY. The median for both new and resale homes continued to break record highs, reaching $299,155 and $223,937, respectively.
While still rising, the rate of price appreciation moderated in the major metros. Austin maintained the highest median home price at $300,365, slightly above 3 percent growth YOY, while the Houston median ($232,542) ticked up just 1.4 percent.
In Dallas ($286,402) and Fort Worth ($224,956), the annual rate of increase was 4.9 and 5.5 percent, the slowest in over three years. In San Antonio, the median home price inched below $218,000 but maintained a solid upward trend.
The statewide median price per square foot (ppsf) rose for the ninth consecutive month, surpassing $114.50. Despite falling inventories, the premium for new rather than resale homes fell nearly $2 to $15.82.
A combination of regional economic growth and scarce land lifted the Austin and Dallas ppsf above $151 and $131, respectively. The ppsf in Fort Worth reached a record level $115.61 as home sizes continued to shrink.
In San Antonio, the median ppsf rose 6.6 percent YOY to $112.69 and could soon surpass the statewide level. In contrast, the Houston ppsf ticked down to $106.36, widening its gap from the other major metros.
The Texas sale-to-list price ratio hovered around 0.96 but exhibited upward pressure from new-home shortages. The Austin ratio moved closer to 0.97, while Dallas and Fort Worth rose to 0.98.
The sale-to-list price ratio was slightly lower at 0.96 and 0.95 in San Antonio and Houston, respectively. In general, elevated sale-to-list price ratios highlighted market imbalances across the state.
The mixture of supply constraints and homes flying off the market reduced homebuyers’ bargaining power.
________________
* All monthly measurements are calculated using seasonally adjusted data, and percentage changes are calculated month over month, unless stated otherwise.

![]()
![]()
![]()
![]()
This story was originally published by Real Estate Center, a Texas A&M publication.


