M&O property taxes in Texas must go
By Vance Ginn, Ph.D. & James Quintero | The Cannon
We should be able to keep what we purchase outright. But that’s not the case with real estate in Texas. Even if a mortgage is paid, many homeowners struggle to afford their yearly local property tax bill. This forces too many Texans to lose their homes. And renters who pay more because of skyrocketing property taxes too often can’t pay their rent.
In the March 1 primary election, 76% of Republican voters supported eliminating property taxes in 10 years—without implementing a state income tax. The Foundation has a plan to achieve this worthy goal.
Some suggest property taxes are a necessary evil because the state (rightfully) prohibits an income tax. But this claim isn’t true for other states. Florida and Tennessee don’t have a state income tax, yet they have a much lower property tax burden.
So we should ask, what are these taxes funding?
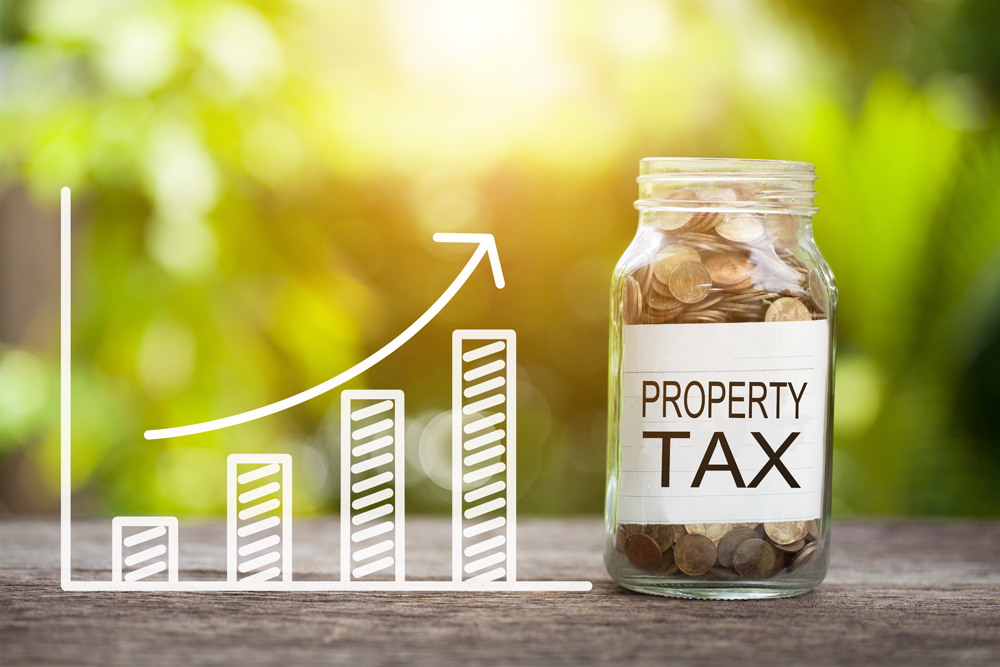
Most property taxes (80%) are collected from taxpayers for the maintenance and operations (M&O) of a local government’s day-to-day expenses. Of these M&O taxes, the school district portion is the largest. The other portion of your property tax bill goes to the interest and sinking (I&S) fund, which pays down local debt. Collectively, local governments siphon about $70 billion (and rising) from Texans every year.
That elevated burden is also growing too fast.
In the last 20 years, property taxes have grown by 181%, far exceeding the average taxpayer’s ability to pay for these taxes—as measured by population growth and inflation. This measure has grown by only about 100% over the same period.
And this excessive burden isn’t met with efficient spending.
Unfortunately, some taxpayer dollars are lost to waste, fraud, and abuse by governments. These happen from paying too much to fix a road to building Taj Mahal-like facilities to giving public sector executives massive severance payments.
Nearly half of property taxes paid go to support government schools, which haven’t always been good stewards of that money. The latest total expenditures available for the 2019-20 school year for 5.5 million students was about $14,000 per student. That’s close to the national average ($15,342), but shocking when we realize that only 40% of Texas students are reading and doing math on grade level, and 95% of kids who fall behind don’t catch up
By comparison, private schools in Texas cost parents about $10,000 per student, which is in addition to the property taxes paid to a government school their kids don’t go to.
How are private schools doing better, for less money? Basically, government schools aren’t spending money efficiently. Misspending is often rampant, revealing itself in expensive management posts and perks, redundant administrative positions, and other frills.
But even if local governments spent property tax dollars efficiently, property taxes hurt lower- and fixed-income Texans by forcing people out of their homes through no fault of their own. Individual liberty should allow people to own what they purchase instead of renting from the government.
The Foundation has a plan to eliminate M&O property taxes by 2033.
In 2021, we helped put into law the state’s spending growth limit—now, the strongest in the nation—of general revenue to grow less than population growth and inflation. As a result, this limitation should lead to recurring surpluses that ought to be returned to taxpayers. This spending limitation should be expanded to local governments, too.
The Texas Legislature should return at least 90% of the general revenue surplus back to taxpayers by lowering school district M&O property tax rates, which the state already has much control over with the Robin Hood redistribution scheme. Doing this each session could take at most 30 years, depending on the fiscal restraint lawmakers show.
Given this delay, we suggest that after about 10 years (if not before) of this buy down, the elimination process should be sped up and done immediately by broadening the sales tax base without raising the overall tax rate.
To help eliminate the rest of M&O property taxes, local governments should follow the state’s lead by using surplus revenue to lower their M&O property taxes. Then when the state broadens the sales tax base, they could eliminate their M&O completely.
By limiting spending and cutting property taxes, Texas could eliminate 80% of its property taxes by 2033. This would also provide time for lawmakers to determine what to do with the other 20% in I&S, which is already approved by local voters.
Our approach would provide a fairer tax system and a more robust economy in Texas. A happy side effect of this could be even more people and businesses moving to Texas along with more economic growth, further easing the tax burden for all, and helping Texas families flourish for generations.


Difficult to fathom the plan’s success. I would first start with massive independent school district consolidations. Secondly, if we are consistently all about economic growth in Texas, then we must also understand we will need more schools and more teachers. Just how much of a broadening sales tax are we talking about? There is a consumption tax versus property tax debate to be had. Other than a slightly higher percentage of charter schools’ students entering college, are there stats that they perform better? Stats reveal otherwise.
Exactly right, Rick. This is an ongoing debate: consumptive versus property tax hikes. Plus, what does “broadening the base” really mean? Previous debates disclose the base would include nearly everything that is sold. Might be helpful to see what is covered specifically, what is excluded and why. Many fixed income households would be further stressed with sales taxes on basic foodstuffs!
San Marcos ISD spends irresponsibly. They could care less the impact on the retired.
They could care less about those on fixed incomes or small business owners struggling during COVID.
Vote them ALL out of office next election. They care more about consultants then they do the kids.
And, the taxpayers cannot afford another tax hike.
Can you provide some objective evidence of your private school average tuition and do you have some relative educational success indicators (scores, performance) of public vs private schools? ( i know you’re limited to words for the article but what you have presented won’t work in a F2F discussion). Also, can you provide some links to articles that illustrate the “rampant misspending”?
Lastly, the article says “this limitation should lead to recurring surpluses…”. Have any idea when we will begin to see surpluses? 2023, 2025?