

Texas Sees Job, Output Gains From 2018 U.S. Tax Cut
Texas is among the top 10 states in terms of tax stimulus received from the Tax Cuts and Jobs Act of 2017. The law, which took effect in 2018 and generated a tax break roughly equivalent to about 1 percent of Texas’ gross domestic product (GDP), likely played an important role in the state’s stronger subsequent job growth relative to the nation.
Lower income taxes have a positive impact on the economy in the short run by generally boosting consumer spending on the demand side and by increasing labor force participation, hours worked, saving and investment on the supply side.
The Tax Cuts and Jobs Act of 2017 (TCJA), signed into law on Dec. 22, 2017, extensively cut individual income and corporate taxes and is widely believed to have contributed to stronger economic activity nationally in 2018.[1]
However, relatively little is known about the act’s impact on economic activity at the state level and, more specifically in Texas. Calculations using a tax simulation model indicate that the size of tax breaks varied widely among states.
Texas, realizing a tax cut of almost $1,400 per tax-filing household in 2018, was one of the top 10 states in terms of the size of the average tax cut relative to state-level income. Elsewhere in the U.S., tax cuts relative to 2017 averaged about $1,000 per household.
Early estimates suggest that Texas received a tax break equivalent to about 1.0 percent of its gross domestic product (GDP), which likely boosted the state’s job growth by 0.3 percentage points in 2018.
Nationally, the size of income tax breaks appears positively associated with job growth, confirming that the TCJA may have significantly helped drive state-level economic activity in 2018.

Tax Code Overhaul
In the most extensive overhaul of the income tax code since the Tax Reform Act of 1986, the TCJA lowered tax rates and broadened most tax brackets (Table 1). Among the most far-reaching changes, the top individual income tax rate was reduced from 39.6 percent to 37 percent and applied to income exceeding $600,000 for married filers—compared with a $470,700 threshold in 2017.[2]
Table 1: TCJA 2017 Reduces Tax Rates, Broadens Tax Brackets
Although federal tax law revisions such as the TCJA apply uniformly in all states, recent research presents compelling evidence that changes in average tax rates—the tax change as a percent of a state’s total income or GDP—vary widely across states.[3]
Importantly, tax changes often vary by income, and states differ in the share of taxpayers in different income groups. For example, analysis of 2016 statistics on tax returns from the Statistics of Income division of the Internal Revenue Service (IRS) shows that Texas has a smaller share of taxpayers in higher-income groups than California. Such differences in the distribution of taxpayers across income groups lead to wide variation in state-level average tax breaks.
Differences in taxpayer characteristics is another reason why state-level tax breaks could vary. Consider the effects of TCJA changes that nearly doubled the standard deduction and restricted the amount of itemized deductions due to state and local taxes and mortgage interest.[4]
The new limitations on itemized deductions would not affect as many taxpayers in Texas as in other states because Texas has a substantially smaller share of taxpayers who itemize—24 percent versus 30 percent for the U.S. On the other hand, with 76 percent of Texas taxpayers taking the standard deduction, the increase in standard deduction from 2017 to 2018 would yield sizeable tax benefits to Texas residents relative to those in other states.
The new tax law also repealed personal and dependent exemptions, increased the amount of child tax credit and considerably reduced the scope of the Alternative Minimum Tax (AMT).[5] To the extent that states differ in the number of taxpayer exemptions and high-income taxpayers subject to the AMT, these changes further expand the impact of tax breaks across states.
State Tax Calculations
Given disparate effects of various TCJA tax changes across states, an important first step is to measure the overall size of state-level tax stimulus due to the TCJA. Although 2018 tax return data at the state level are unavailable, tax changes due to the new law can be approximated using 2016 Statistics of Income data. They provide information on the number of taxpayers and their tax filing characteristics for various income groups at the state level.
Taxes by state for the average 2016 taxpayer within various income groups can be calculated under the 2017 and 2018 tax laws using the National Bureau of Economic Research’s “Taxsim model,” a way to simulate tax liabilities.[6] While imprecise, the difference between 2018 and 2017 taxes computed this way should yield a good approximation of changes attributable to the TCJA at the state level.
The Taxsim model calculates taxes based on a series of input variables, the most important of which are income, tax-filing status, number of dependents and deductions such as mortgage interest and property taxes. These input variables are set to their averages in Statistics of Income (SOI) data for each of 10 income groups for 2016.[7]
State-Level Tax Breaks
Tax calculations indicate that higher-income groups in Texas received larger tax breaks as a percent of their income from 2017 to 2018, while in other states, middle-income groups got larger tax cuts (Chart 1).
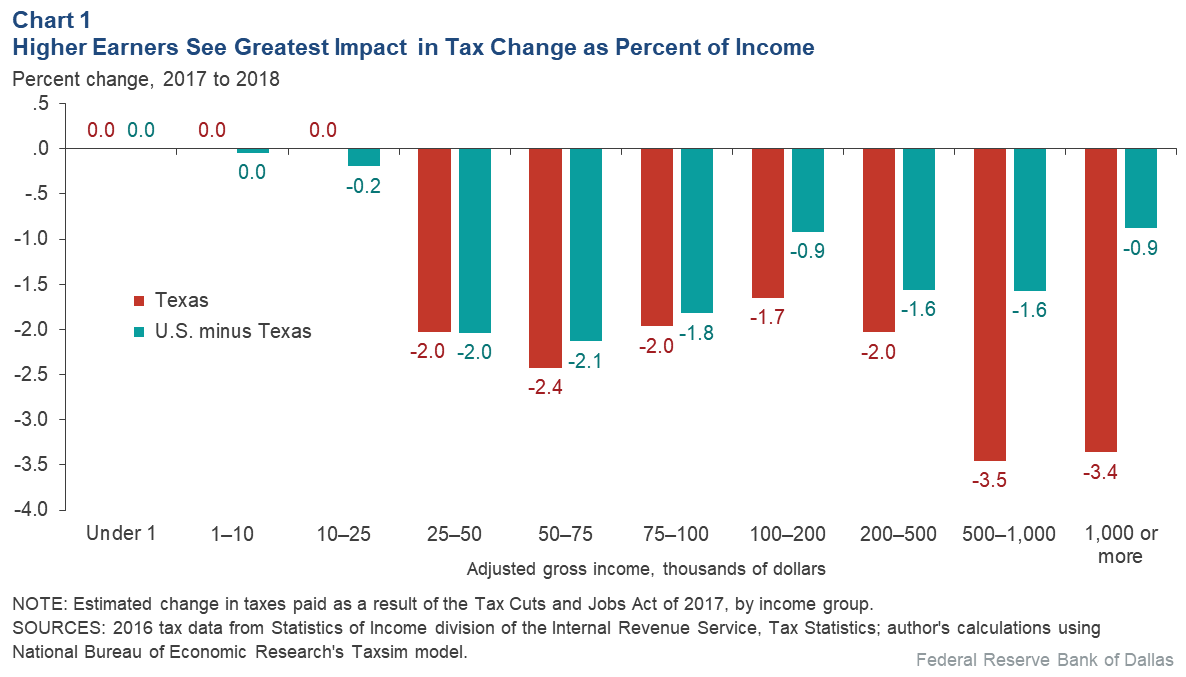
Taxpayers with income under $25,000 pay very little in taxes and, therefore, received an almost zero tax break, while taxes for Texans earning more than $200,000 declined by almost 2.8 percent of their income. The difference between Texas and the remaining states is striking—tax breaks for low- to middle-income groups are similar to the rest of the nation, but higher-income groups in Texas got bigger tax breaks.
A partial explanation for this gap among higher income taxpayers is that the 2017 tax law limited key itemized deductions that disproportionately benefited the rich. Also, fewer Texans itemize their taxes and, among those who do, the average deduction is lower than the national average. On the other hand, taxpayers in other states such as California and New York were unable to capitalize on itemized deductions to the extent they could in 2017.
A nearly across-the-board decline in taxes translated to substantial tax stimulus at the state level; the size of the stimulus varied widely across states depending on the concentration of taxpayers in income groups that received the largest tax cuts and the impact of other TCJA changes that varied from state to state because of differences in local taxpayer characteristics.
Texas ranked ninth among all states in terms of the average tax break relative to income as a result of the TCJA (Chart 2). Total tax liabilities as a share of income in Texas declined 2.1 percentage points in 2018, significantly more than the average rate of 1.4 percent for the rest of the U.S. (Table 2).[8] In contrast, as one would expect, tax changes from 2016 to 2017 were almost nonexistent.
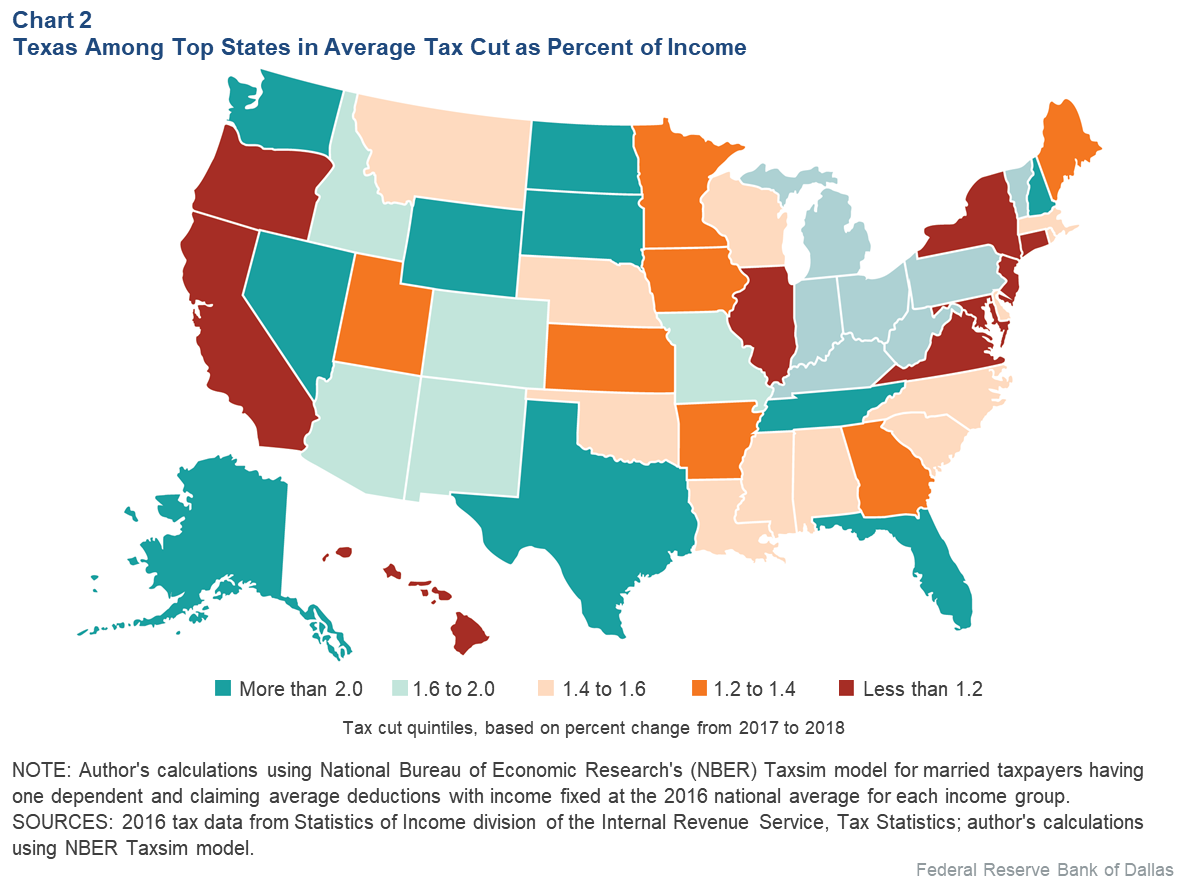
Table 2: Summary of Tax Changes: Texas Versus Rest of U.S.
States with more expensive housing and higher state and local taxes, such as California and New York, trailed other states. Nonetheless, every state experienced a tax decline and, all else equal, disposable income rose after the TCJA.
It is worth noting that the tax calculations in Chart 2 are proxies for the actual tax breaks at the state level, as they are based on taxpayers’ average incomes and other characteristics. While inexact, they still provide useful insight into the magnitude of tax breaks for average taxpayers and relative rankings of states.
Assessing Economic Activity
Lower income taxes are expected to positively affect the economy in the short term by boosting consumer spending and by increasing labor force participation, hours worked, saving and investment, although the exact magnitude of these effects is less clear.
Given the short time frame since the TCJA took effect, data limitations preclude a precise assessment. Existing estimates based on economic models and plausible assumptions suggest short-term effects on national GDP of 0.3–0.9 percent.[9] The impact of individual income tax cuts is likely smaller, as these estimates also include the effects of corporate tax reductions.
Long-term gains arising from tax cuts are partially offset by increases in federal deficits, which can crowd out private investment, and expectations of higher future taxes. The TCJA is widely expected to reduce tax revenue during the 2018 to 2027 window. The Joint Committee on Taxation projects that tax revenue will decline by $1.5 trillion, with about $1.2 trillion of the decline due to changes in the individual income taxes.[10]
Part of that decline would be offset by a projected 0.7 percent increase in GDP relative to its potential attributable to the law change. Existing estimates for the TCJA suggest a long-term effect on GDP—10 years after the law change—in the range of 0.3 to 0.7 percent.
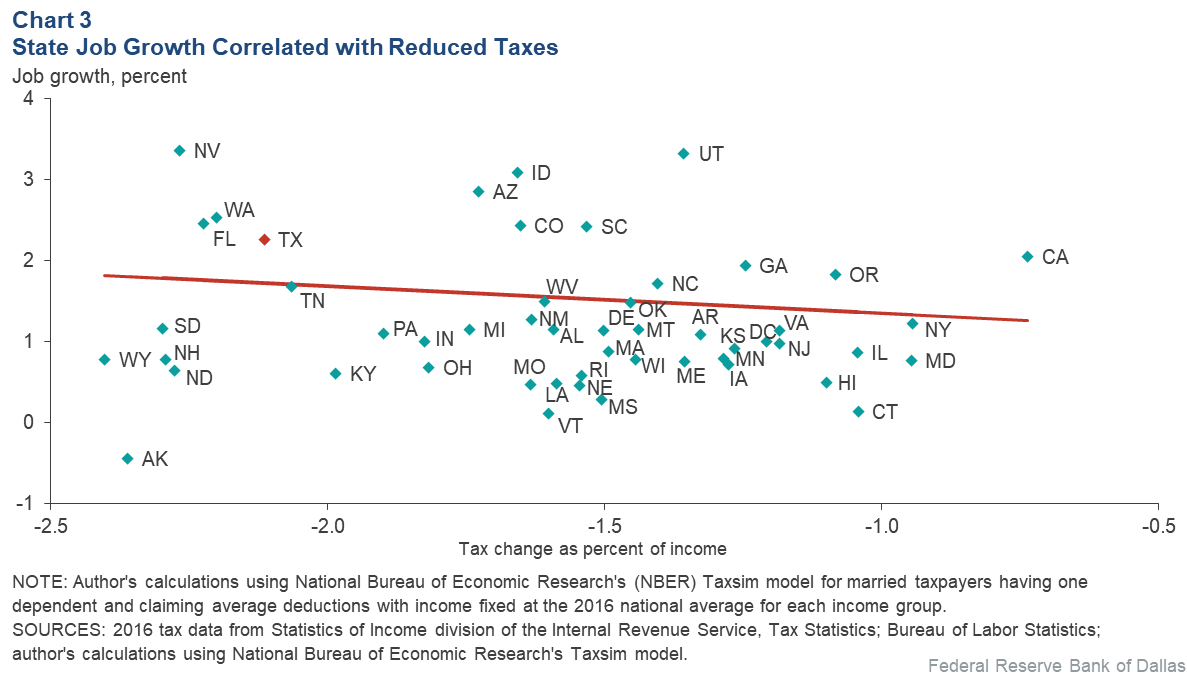
These estimates are based on national data. Exploiting state-level differences in average tax breaks can provide useful insight regarding the relationship between tax cuts and economic activity in 2018.[11] Plotting state-level average tax change and job growth yields what appears to be a negative relationship—larger tax cuts are correlated with stronger growth in 2018 (Chart 3).
Evaluating State Benefits
There are multiple reasons why abundant caution is required when interpreting state-level results. First, if the 2017 tax cuts occurred in response to weak economic activity, the relationship would underestimate the actual effect. Secondly, differences in 2018 job growth could also be due to other factors likely correlated with tax cuts, conflating its effects.
For example, a permanent reduction in corporate income taxes accompanied lower individual income taxes. Thus, if states getting larger individual income tax breaks also gained from corporate tax cuts, then the relationship in Chart 3 would be an overestimate of the true effect of income tax cuts.[12] Furthermore, states may also change their spending policies in response to the tax cuts, in which case part of the relationship in Chart 3 could simply reflect the impact of spending changes.
Nevertheless, after accounting for these other factors, the high correlation between tax cuts and job growth across states becomes even stronger.[13] Therefore, the more-generous tax break in Texas from the TCJA likely played an important role in Texas’ 2018 stronger job growth relative to the nation.
Notes
1. “The Near-Term Growth Impact of the Tax Cuts and Jobs Act,” by Karel Mertens, Federal Reserve Bank of Dallas Working Paper no. 1803, March 2018.
2. These individual income tax changes are set to expire after eight years, in 2025, unless Congress extends them. In addition to the individual income tax changes, the 2017 tax law cut the top corporate tax rate permanently from 35 percent to 21 percent and made far-reaching changes to the treatment of foreign-sourced income and international financial flows.
3. “Tax Cuts for Whom? Heterogeneous Effects of Income Tax Changes on Growth and Employment,” by Owen M. Zidar, Journal of Political Economy, vol. 127, no. 3, 2019, pp. 1437–72.
4. The standard deduction increased from $13,000 in 2017 to $24,000 in 2018 for married filers. The deduction due to state and local taxes has been capped at $10,000. The mortgage interest deduction was restricted to interest on the first $750,000 of mortgage debt compared with $1 million in 2017.
5. For more details, see The Tax Policy Center’s Briefing Book, www.taxpolicycenter.org/sites/default/files/briefing-book/bb_full_2018_1.pdf.
6. All tax calculations used the National Bureau of Economic Research (NBER) Taxsim model, which is available from http://users.nber.org/~taxsim/. See “An Introduction to the TAXSIM Model,” by Daniel Feenberg and Elisabeth Coutts, Journal of Policy Analysis and Management, vol. 12, no. 1, 1993, pp. 189–194.
7. For example, taxes for a representative taxpayer in the $75,000–$100,000 income group in Texas are calculated for the average income within that income group, $86,662, assuming the taxpayer is married and filing jointly, with one dependent and a standard deduction of $24,000 in 2018. Similar calculations were made for representative taxpayers in each state in each major income group.
8. While total tax liabilities include federal income, state income and payroll taxes, the decline was almost entirely driven by change in federal income taxes.
9. For a review of recent estimates, see “A Preliminary Assessment of the Tax Cuts and Jobs Act of 2017,” by William Gale, Hillary Gelfond, Aaron Krupkin, Mark J. Mazur and Eric Toder, National Tax Journal, vol. 71, no. 4, 2018, pp. 589–611.
10. “Estimated Budget Effects of the Conference Agreement for H.R.1, the ‘Tax Cuts and Jobs Act,’” Joint Committee on Taxation, JCX-67-17, Washington, D.C., December 2017.
11. See note 3 for source of methodology used in calculation.
12. The relationship will also be an overestimate if states with larger tax cuts also were less adversely affected by 2018 tariff changes and trade policy uncertainty.
13. “Did Tax Cuts and Jobs Act Create Jobs and Stimulate Growth? Early Evidence Using State-Level Variation in Tax Changes,” by Anil Kumar, Federal Reserve Bank of Dallas Working Paper, forthcoming.
About the Author
Kumar is a economic policy advisor and senior economist in the Research Department at the Federal Reserve Bank of Dallas.
Source: Federal Reserve Bank of Dallas


