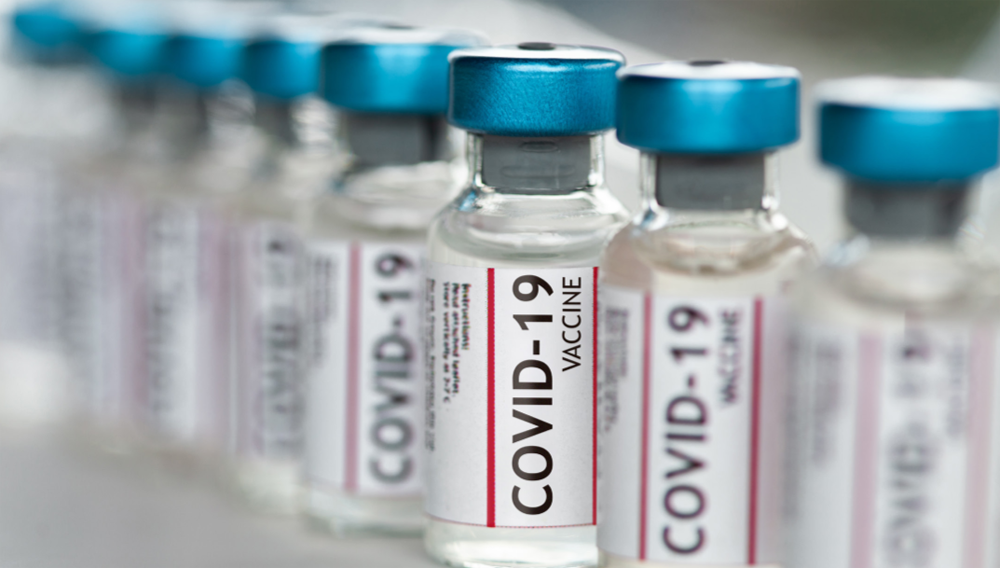
Texas is 2021’s 3rd least vaccinated state
Reprinted with permission from WalletHub
With 93% of unvaccinated adults saying they don’t ever plan to get the COID-19 vaccine, the personal-finance website WalletHub today released its report on 2021’s States that Vaccinate the Most, as well as accompanying videos and expert commentary.
In order to find out which states vaccinate most, WalletHub analyzed the 50 states and the District of Columbia across 17 key metrics, ranging from share of vaccinated children to share of people without health insurance to flu vaccination rate among adults.
Vaccination in Texas (1=Best; 25=Avg.):
- 30th – Influenza Vaccination Rate in Children Aged 6 Months to 17 Years Old
- 41st – Share of Teenagers Aged 13-17 with Up-To-Date HPV Vaccination
- 38th – Share of Teenagers Aged 13-17 with MenACWY Vaccination
- 48th – Flu Vaccination Coverage Rate Among Adults
- 44th – Share of Adults with Tetanus Vaccination
- 38th – Share of Adults Aged 60 and Older with Zoster Vaccination
- 33rd – Share of Children 19-35 Months old Living in Poverty with Combined 7-Vaccine Series
- 51st – Share of Civilian Noninstitutionalized Population without Health Insurance Coverage
- 47th – Share of Children Under 6 Years Old Participating in an Immunization Information System
Vaccination Rates by State
| Overall Rank* |
State | Total Score | Children & Teenagers Immunization Rates | Adult & Elderly Vaccination Rates | Immunization Uptake Disparities & Influencing Factors |
|---|---|---|---|---|---|
| 1 | Massachusetts | 85.59 | 1 | 6 | 2 |
| 2 | Vermont | 78.57 | 12 | 1 | 1 |
| 3 | Rhode Island | 76.57 | 3 | 5 | 4 |
| 4 | New Hampshire | 74.16 | 5 | 4 | 9 |
| 5 | North Dakota | 70.30 | 2 | 10 | 27 |
| 6 | Maryland | 69.08 | 6 | 18 | 3 |
| 7 | Nebraska | 68.33 | 9 | 7 | 11 |
| 8 | Connecticut | 66.88 | 4 | 23 | 8 |
| 9 | Washington | 65.76 | 25 | 3 | 7 |
| 10 | Virginia | 65.63 | 11 | 13 | 13 |
| 11 | Maine | 65.32 | 15 | 12 | 6 |
| 12 | South Dakota | 64.27 | 14 | 11 | 18 |
| 13 | Pennsylvania | 63.75 | 13 | 14 | 12 |
| 14 | Iowa | 63.27 | 16 | 8 | 23 |
| 15 | Delaware | 62.24 | 7 | 25 | 17 |
| 16 | Wisconsin | 61.26 | 30 | 2 | 25 |
| 17 | Oregon | 60.41 | 22 | 15 | 14 |
| 18 | Colorado | 60.40 | 18 | 17 | 16 |
| 19 | District of Columbia | 59.84 | 8 | 26 | 20 |
| 20 | Minnesota | 59.05 | 40 | 9 | 5 |
| 21 | West Virginia | 54.28 | 21 | 24 | 28 |
| 22 | Kansas | 53.93 | 29 | 19 | 30 |
| 23 | North Carolina | 52.06 | 26 | 21 | 40 |
| 24 | New Mexico | 51.66 | 24 | 30 | 21 |
| 25 | Illinois | 51.63 | 17 | 33 | 19 |
| 26 | California | 48.77 | 36 | 27 | 22 |
| 27 | Tennessee | 48.40 | 10 | 40 | 37 |
| 28 | Kentucky | 47.69 | 32 | 29 | 34 |
| 29 | New York | 47.08 | 28 | 39 | 10 |
| 30 | Montana | 46.78 | 49 | 16 | 41 |
| 31 | Arkansas | 45.94 | 19 | 34 | 42 |
| 32 | Utah | 45.87 | 46 | 22 | 38 |
| 33 | Ohio | 45.83 | 41 | 28 | 33 |
| 34 | Michigan | 45.73 | 38 | 31 | 31 |
| 35 | Oklahoma | 43.66 | 50 | 20 | 43 |
| 36 | Missouri | 42.88 | 42 | 32 | 36 |
| 37 | Hawaii | 42.01 | 33 | 36 | 35 |
| 38 | Indiana | 40.58 | 43 | 35 | 29 |
| 39 | Alaska | 39.58 | 44 | 37 | 26 |
| 40 | Florida | 39.22 | 20 | 48 | 24 |
| 41 | Louisiana | 37.85 | 23 | 47 | 47 |
| 42 | South Carolina | 37.64 | 35 | 38 | 48 |
| 43 | Wyoming | 36.76 | 39 | 41 | 46 |
| 44 | New Jersey | 34.85 | 27 | 50 | 15 |
| 45 | Idaho | 34.71 | 37 | 45 | 45 |
| 46 | Alabama | 34.59 | 31 | 43 | 50 |
| 47 | Nevada | 33.40 | 34 | 49 | 32 |
| 48 | Arizona | 33.13 | 48 | 44 | 39 |
| 49 | Texas | 32.60 | 45 | 42 | 44 |
| 50 | Georgia | 29.95 | 47 | 46 | 49 |
| 51 | Mississippi | 13.11 | 51 | 51 | 51 |
Note: *No. 1 = Vaccinates the Most
With the exception of “Total Score,” all of the columns in the table above depict the relative rank of that state, where a rank of 1 represents the best conditions for that metric category.


