

Austin Economy Strong In June
The Austin economy posted strong performance in June. The Austin Business-Cycle Index accelerated, though labor force growth remained tepid. Jobs were added in most industries; however, health and education services remained weak.
Hourly wages continued to fall in June, and home sales rose.
Business-Cycle Index
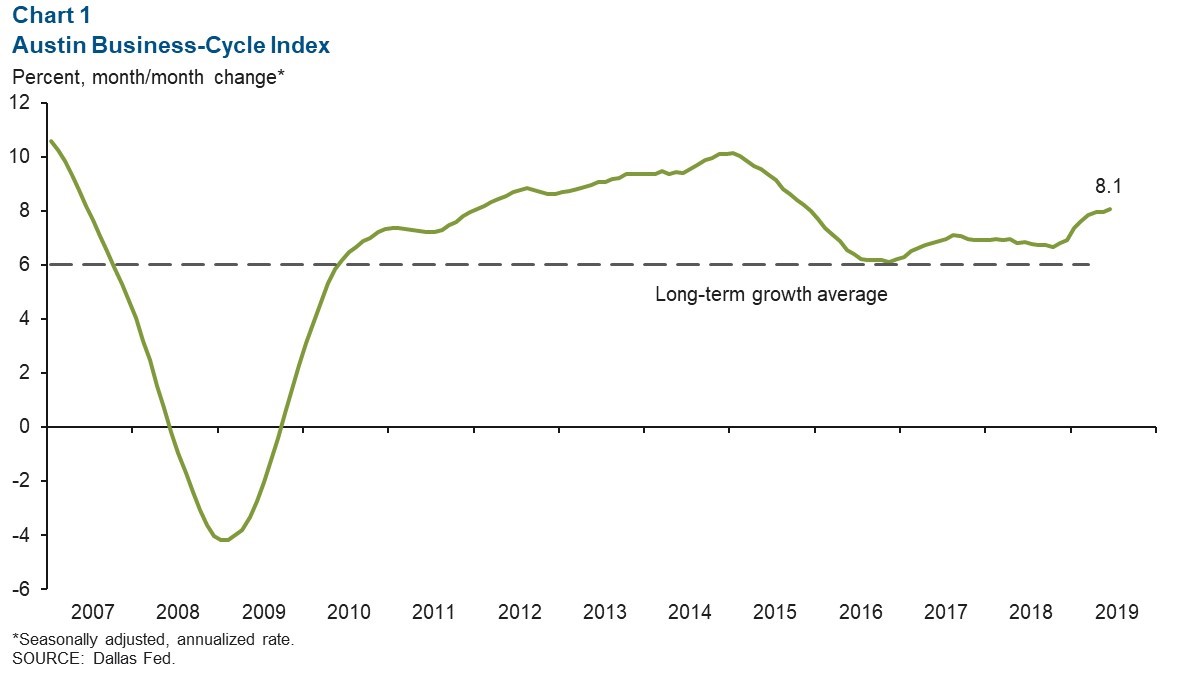
The Austin Business-Cycle Index accelerated to an annualized rate of 8.1 percent in June—the strongest expansion since November 2015 (Chart 1).
Recent strength in the index was propelled by historically low unemployment rates and robust job growth, suggesting healthy performance in the metro.
Labor Market
Tight Labor Market Persists

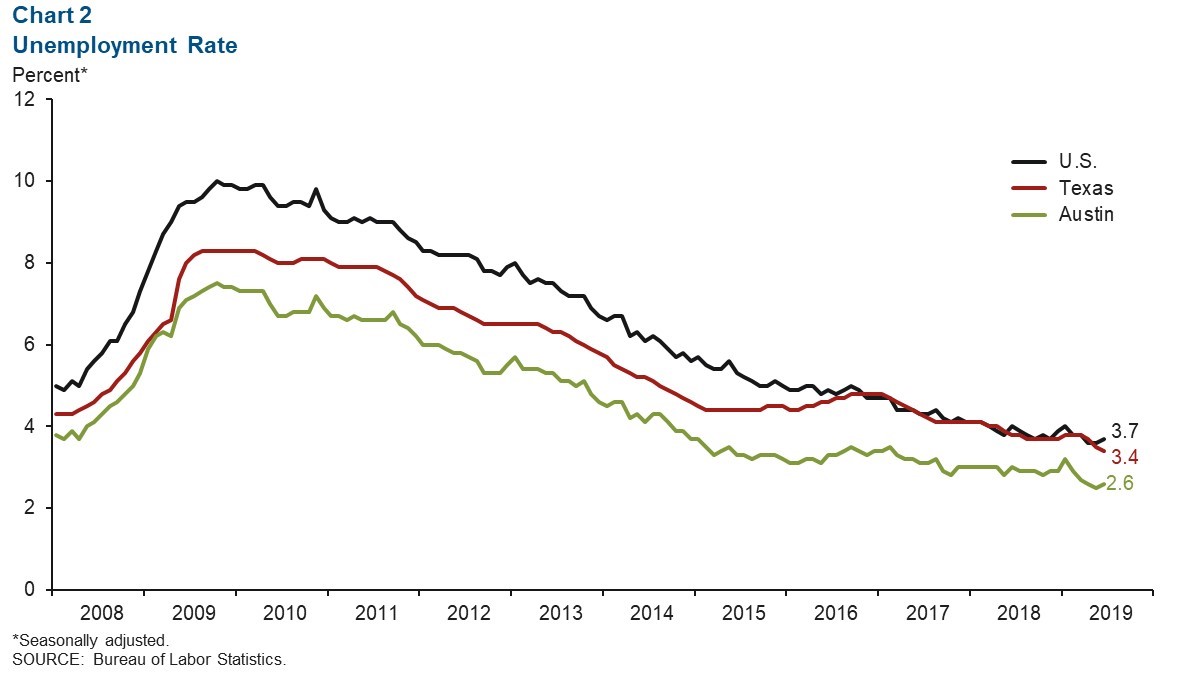
Austin’s unemployment rate inched up to a low 2.6 percent in June (Chart 2). The unemployment rate in the nation ticked up to 3.7 percent, while the state declined further to 3.4 percent—the lowest posting since the data series began in 1976.
Year to date, the metro’s labor force grew 0.8 percent (annualized), well below the 3.6 percent and 2.7 percent expansion in 2017 and 2018, respectively, further signaling an increasingly tight labor market in Austin.
Recent Job Growth Up for Most Industries
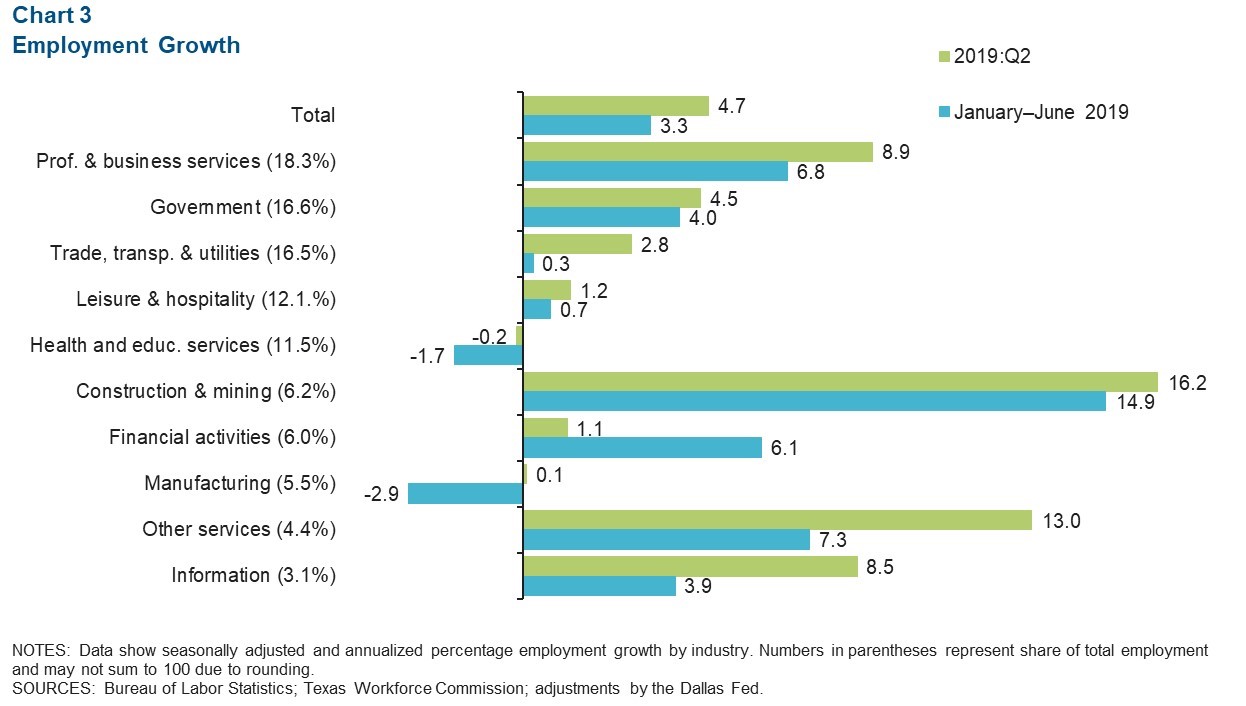
Payrolls in Austin increased at a 4.7 annualized rate during the three months ending in June (Chart 3). Jobs related to construction and mining accelerated to an annualized 16.2 percent, or a net 2,500 jobs.
The professional and business services sector saw a substantial increase (8.9 annualized percent, or 4,300 jobs), where approximately half of such jobs were related to professional, scientific and technical services.
The information and government sectors also posted healthy growth. Meanwhile, manufacturing jobs grew slightly, and health and private education services payrolls continued to contract.
Hourly Wages Fall
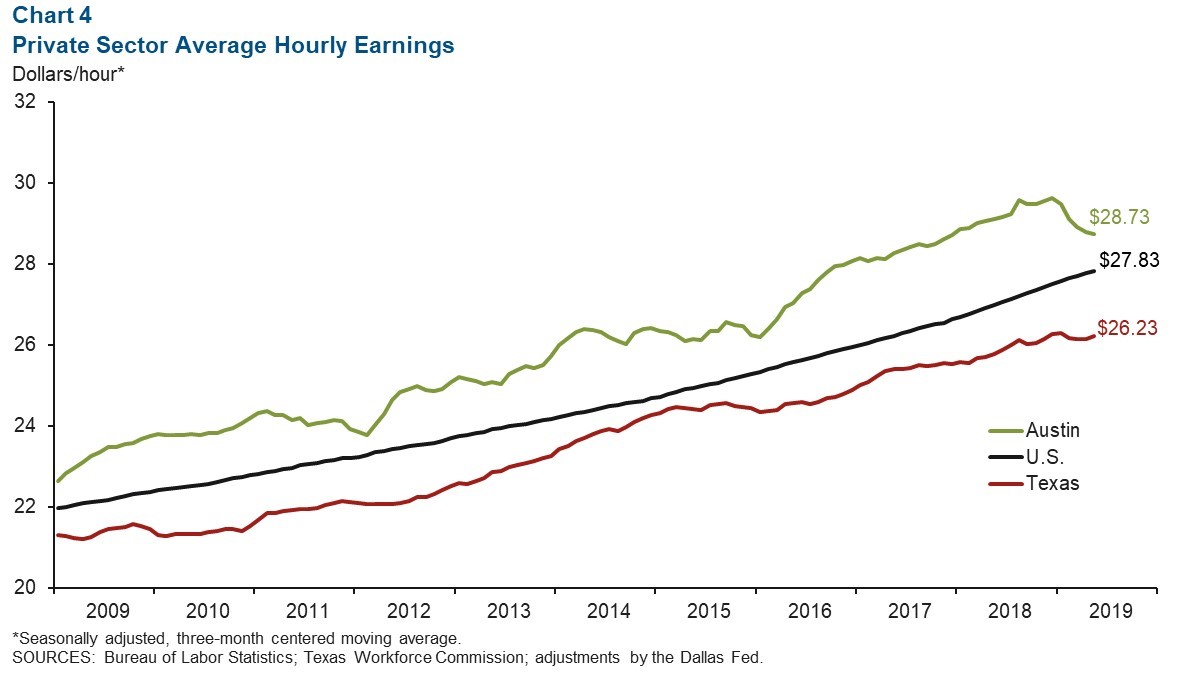
The three-month moving average of private sector hourly wages for the metro area ticked down to $28.73 in June, the fifth consecutive month of decline (Chart 4).
Austin wages decreased 0.6 percent year over year, whereas wages at the state and national level increased 2.1 and 3.1 percent, respectively.
Part of the recent drop in the metro’s average wage may be due to compositional effects, where the rapidly growing construction and mining sector dragged down the average.
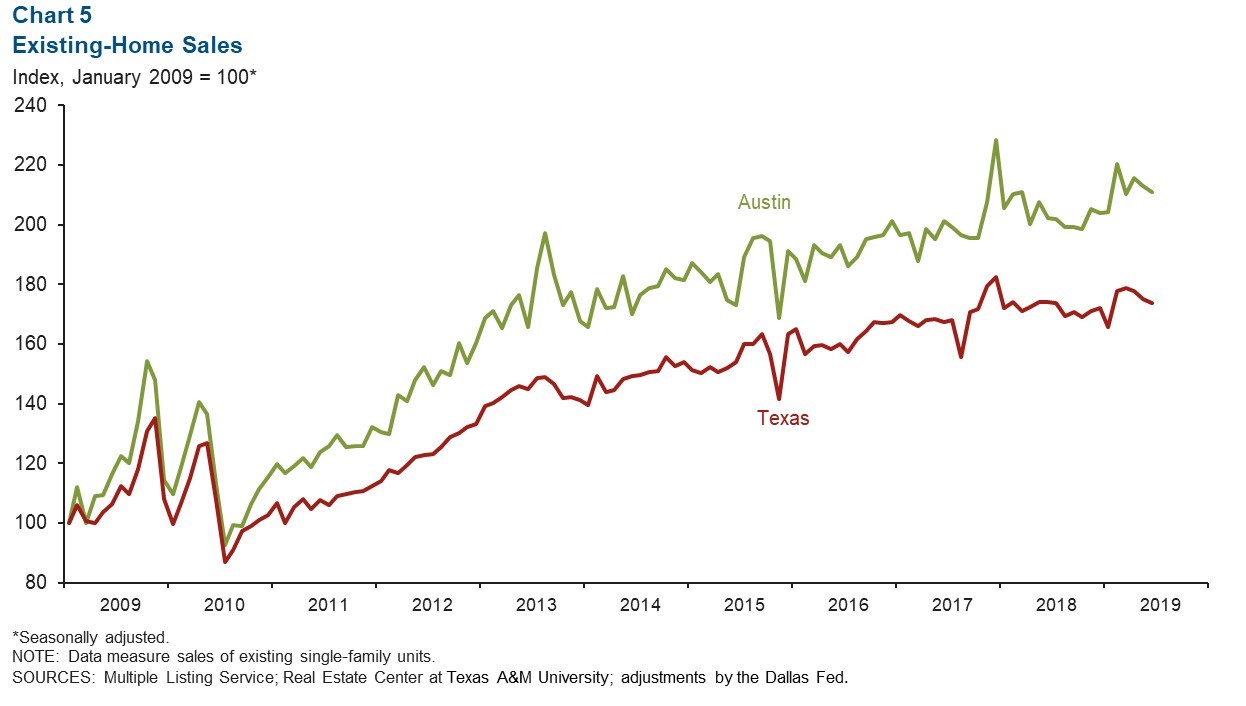
Real Estate
The housing market remained active in the Austin metro area in recent months, following last year’s healthy performance.
Aggregate sales volumes in the first two quarters increased 3.0 percent relative to the same time period last year, well above the 1.0 percent uptick for the state (Chart 5).
Inventory edged down to 2.4 months in June, well below the six months considered a balanced market. However, general sentiments regarding further building may be starting to wane from last year’s activity.
This year through June, combined single and multifamily construction permits in the metro contracted 7.5 percent compared with the same period last year; the state saw a 2.9 percent decline for that period.
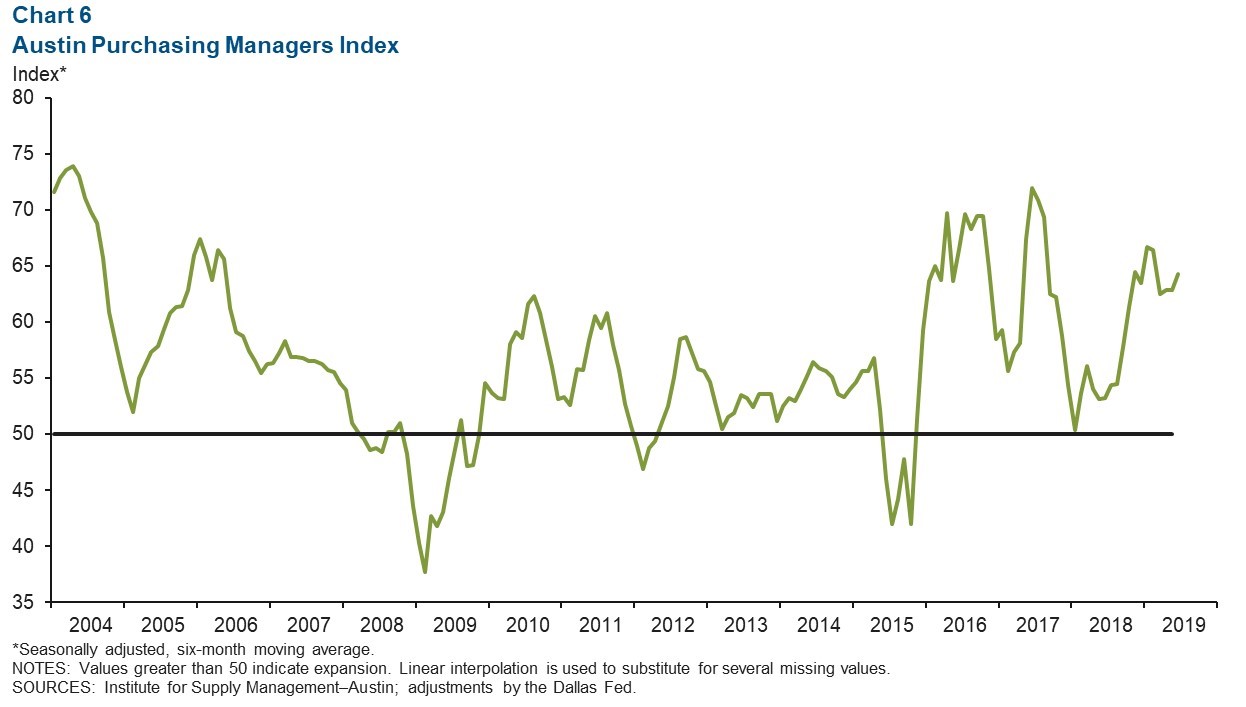
Austin Purchasing Managers Index
The Austin Purchasing Managers Index indicated solid expansion in the area’s manufacturing sector in June. The six-month moving average of the headline index rose to 64.3, well above the postrecession average of 56.6 (Chart 6).
The production, new orders, inventory, employment and order backlog indexes reflected growth in June, whereas supplier delivery and prices indexes signaled weakening.
NOTE: Data may not match previously published numbers due to revisions.
Source: Federal Reserve Bank of Dallas – Austin Economic Indicators | Judy Teng at judy.teng@dal.frb.org. Austin Economic Indicators is released on the first Thursday of every month.


