Dallas Fed Release November Energy Indicators
![]() Oil prices tumbled in November due to the United States’ Iran policy, surging U.S. production, rising inventories and concerns about the global demand outlook…
Oil prices tumbled in November due to the United States’ Iran policy, surging U.S. production, rising inventories and concerns about the global demand outlook…
![]()
Oil prices tumbled in November due to the United States’ Iran policy, surging U.S. production, rising inventories and concerns about the global demand outlook. Meanwhile, refinery utilization on the Gulf Coast has been high despite falling margins.
Taking stock of the energy job recovery, 39 percent of the mining jobs and roughly 35 percent of the energy-related manufacturing jobs shed in the 2015–16 oil bust have been recovered.
![]()
Prices
The spot price of Brent crude rose from the mid-$60s in first quarter 2018 to the mid-$70s in the second and third quarters, largely due to expected U.S. sanctions on Iran, eroding crude production in Venezuela and a healthy demand outlook. In October, Brent rose to a near four-year high of $82 as the deadline for Iranian sanctions loomed (Chart 1).
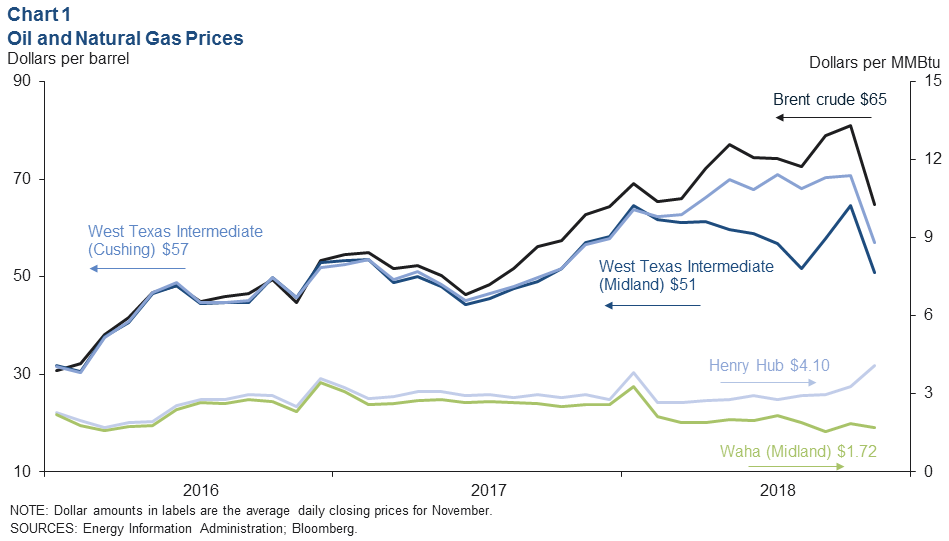
November saw prices erode substantially. Brent averaged $62 in the second half of the month, closing as low as $59 on Nov. 23 and 30.
OPEC and Russia increased production, ostensibly to offset the effects of U.S. sanctions on Iran, but the extension of waivers for importers of Iranian crude just before the U.S. midterm elections undermined expectations of a severe reduction in Iranian crude exports. This bolstered the perception that crude markets would remain well supplied in the near future.
October saw the price of West Texas Intermediate (WTI) Midland crude rise relative to Cushing as early completion of the Sunrise pipeline allowed more production to flow.
In November, Midland prices fell in tandem with Brent, reaching as low as $43 on Nov. 23 and 30—below average breakeven prices for new wells in the region. Producers expect discounts on Midland crude to remain significant until sufficient pipeline and export capacity is installed by early 2020.
Wintry weather along with a drop in already seasonally low natural gas inventories allowed the Henry Hub average price to rise above $4 per million British thermal units (MMBtu) in November, closing as high as $4.70 on Nov. 21.
In contrast, pipeline-constrained West Texas natural gas (Waha) fell to $1.72 per MMBtu for the month, closing as low as 30 cents on Nov. 27.
![]()
U.S. Production
Monthly U.S. production rose to 11.4 million barrels per day (mb/d) in August and 11.5 mb/d in September, much higher than the 11 mb/d estimated from weekly data.
The higher output led the Energy Information Administration (EIA) to revise its U.S. production forecasts to 11.7 mb/d for December 2018 and 12.4 mb/d for December 2019 (Chart 2).
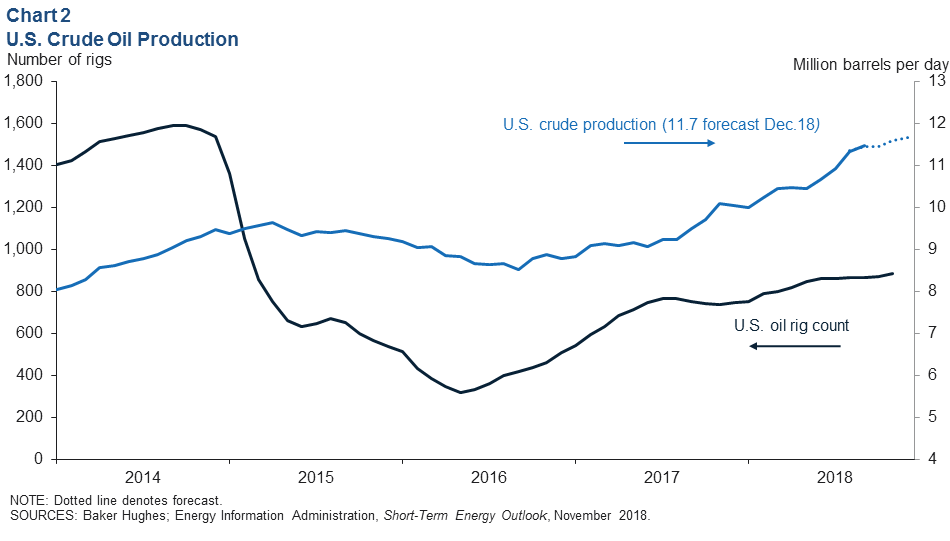
Adding to the bearish price news, U.S. crude inventories continued to build in November on a seasonally adjusted basis. U.S. production growth and inventory numbers contributed to lower global crude prices in November.
![]()
Crude Oil and Products Stocks
The days of supply of U.S. gasoline (barrels of inventory divided by estimated consumption) rose steadily from 24.9 days in May—just below the five-year rolling average of 25—to 26.4 days in September.
Supplies remained elevated at 26.1 days in November, putting downward pressure on gasoline prices (Chart 3). U.S. distillate days of inventory have been rising, up from 30.3 days in April to 32.4 in October. Distillate days of inventory were 32.2 in November, below the five-year rolling-average of 35.2.
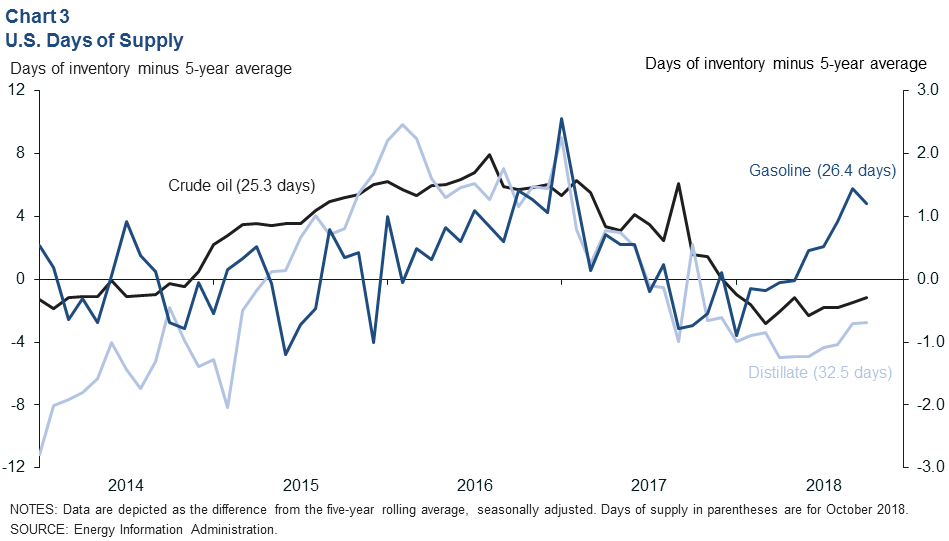
Healthy refinery runs have kept the recent increase in days of supply of crude oil at 25.9, below the five-year average of 26.6. Rising crude stocks have put downward pressure on oil prices.
![]()
Refinery Margins
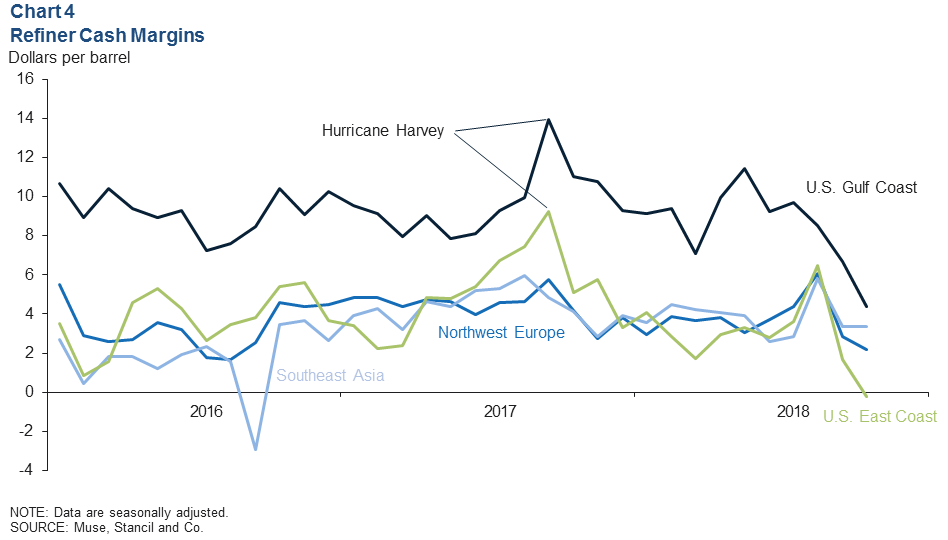
Seasonally adjusted refinery cash margins dropped in September and October on the U.S. Gulf Coast (Chart 4). However, relative to other regions of the U.S. and the world, Gulf Coast margins remain elevated, owing in part to access to lower-cost crude oil and natural gas.
Gulf Coast refinery utilization was a seasonally adjusted 98.7 percent in October—the highest rate since EIA data for the region began—and it remained high at 96 percent in November.
With falling oil prices and rising gasoline inventories, the weekly retail price for regular gas in Texas declined from $2.61 per gallon for the week of Oct. 15 to $2.09 by the week of Dec. 3. On-highway diesel prices on the Gulf Coast fell a more modest 17 cents to $3 over that same period.
![]()
Global Balances
The EIA’s November Short Term Energy Outlook paired its more robust U.S. production forecast with modestly lower expectations for global demand growth in 2019 of 1.4 mb/d (Chart 5). The combination contributed to a projected global stock build of 0.6 mb/d in 2019, double the October projection.
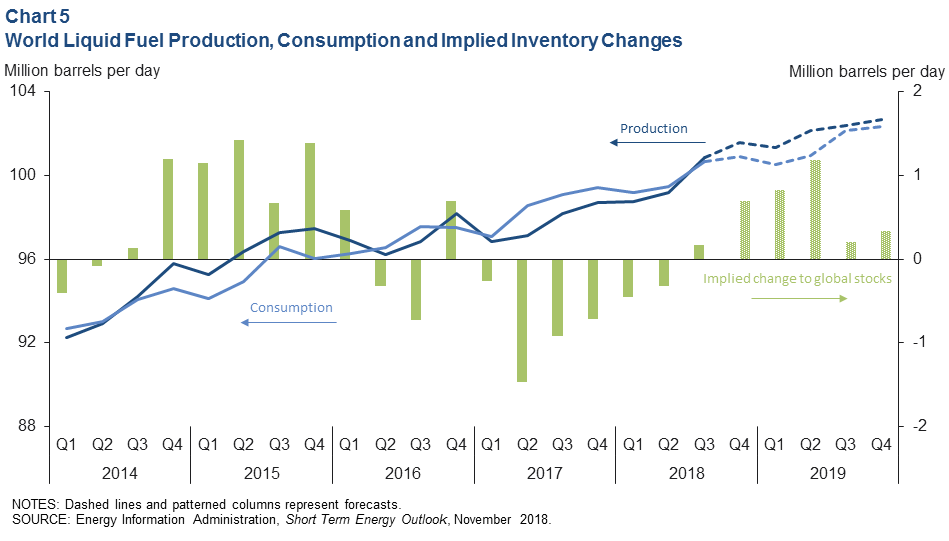
OPEC, Russia and other signatories to the 2016 Vienna agreement to cut oil production began a two-day meeting Dec. 6 to decide on potential production targets for next year.
OPEC leadership had already signaled some willingness to cut production and balance the market. At the start of December, the premier of Alberta, Canada, instructed producers there to lower output by 8.7 percent (about 0.3 mb/d) starting in January 2019.
Should OPEC announce plans to lower output and Canadian production fall, the reductions would support global crude and fuel prices.
![]()
Employment
Based on data through October, and incorporating early benchmark revisions through second quarter 2018, Texas had recovered 44,900 of the 115,600 oil and gas mining jobs lost in the 2015–16 oil bust (or 39 percent)—7,000 fewer jobs than unrevised estimates had implied.
All of the recovery to date has been in support activities for mining (mostly oilfield services companies). In fact, extraction (mostly exploration and production firms) has continued to shed jobs on net (Chart 6).
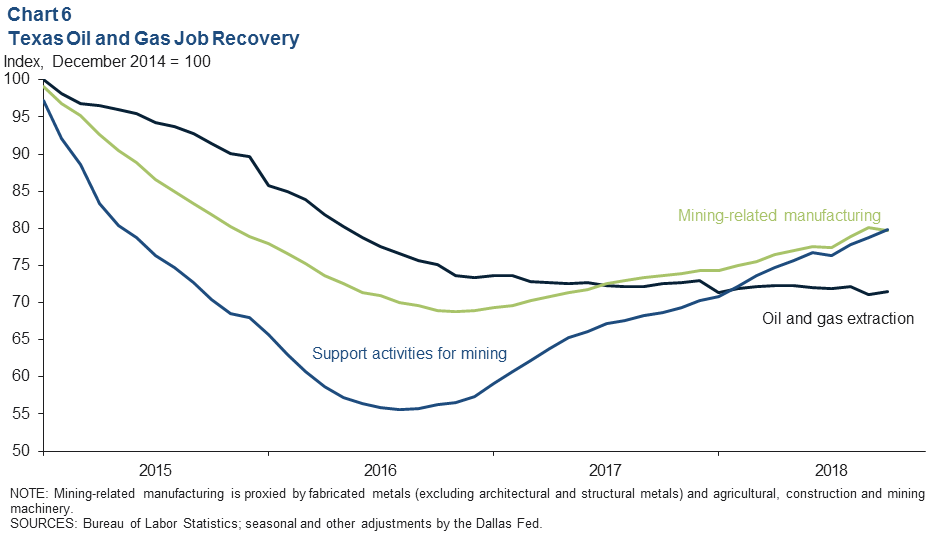
Based on unrevised employment estimates, support activities for mining grew at an annual pace of 19.1 percent (7,000 jobs) for the three months ending in October, while the extraction sector contracted 2 percent (400 jobs) over the same time.
Fabricated metals manufacturing in Texas, excluding architectural and structural metals, also tends to fluctuate with support activities for mining.
As of October, it had recovered 9,900 of the 26,500 jobs lost (38 percent). Related manufacturing jobs have also been recovering statewide.
Mining and oil and gas field machinery manufacturing lost 23,000 jobs from late 2014 through the end of 2016, according to the Quarterly Census of Employment and Wages. As of October 2018, the sector had recovered 7,300 jobs.
[divide icon_position=”left” width=”short” color=”#”]
Source: Federal Reserve Bank of Dallas. Questions can be addressed to Jesse Thompson at jesse.thompson@dal.frb.org.


