

Hays County, Central Texas Cities Will Receive Over $10M In Sales Tax Revenue This Month
Corridor Staff
AUSTIN — Texas Comptroller Glenn Hegar announced today he will send cities, counties, transit systems, and special purpose taxing districts $765.3 million in local sales tax allocations for September, 4.5 percent less than in September 2019. These allocations are based on sales made in July by businesses that report tax monthly.
Rising COVID-19 infection rates in July likely suppressed economic activity.
SEE BREAKDOWN FOR INDIVIDUAL CITIES
THROUGHOUT HAYS COUNTY BELOW
In the City of San Marcos, sales tax revenues represent 44.4% of the general fund budget. Sales tax revenue is the largest single revenue source supporting general government services, and this is the same for nearly all cities across the state.
On June 3, the San Marcos City Council considered a resolution directing staff to calculate the voter-approval tax rate in the manner provided for a special taxing unit by using an 8 percent threshold for revenue.
The Council is allowed to consider a tax rate above the 3.5% cap established by Senate Bill 2, which was passed in the 86th legislative session due to the coronavirus pandemic.
READ MORE…
.
..Thought SB2 Would Help Lower Your Property Taxes? Doesn’t Look Like It. SMTX City ……Council To Consider 8 Percent Tax Rate.
.
..Council Approves Resolution For Staff To Calculate 8 Percent Tax Rate
.
..San Marcos City Council Discuss Tax Rate Increase Of No-More Than 7%
.
• MONTHLY COUNTY & MUNICIPAL RUNDOWN •
.
September 2020 Sales Tax Revenue
Local Central Texas Cities: $5,962,899.05
Hays County: $2,418,059.09
Combined Total: $8,380,958.14
*These allocations are based on sales made in June by businesses that report tax
monthly and on sales made in April, May, and June by quarterly filers.
•
August 2020 Sales Tax Revenue
Local Central Texas Cities: $7,218,919.12
Hays County: $2,814,386.45
Combined Total: $10,033,305.57
*These allocations are based on sales made in May.

Year To Date Sales Tax Revenue
Local Central Texas Cities: $54,448,209.77
Hays County: $21,605,690.11
Countywide Combined Total: $76,053,899.88
*Year To Date: January-December calendar year
• MONTHLY COUNTY & MUNICIPAL BREAKDOWN •
Can’t see the whole table? Touch it and scroll right!
| CITY | RATE | NET PAYMENT THIS PERIOD | COMPARABLE PAYMENT PRIOR YEAR | % CHANGE |
PAYMENT YTD | PRIOR YEAR PAYMENT YTD | % CHANGE |
| BUDA | 1.50% | $677,729.01 | $647,376.17 | 4.68% | $6,128,196.32 | $5,642,125.98 | 8.61% |
| DRIPPING SPRING | 1.25% | $271,517.15 | $246,972.20 | 9.93% | $2,317,216.82 | $2,053,264.70 | 12.85% |
| HAYS | 1.00% | $2,267.63 | $1,453.25 | 56.03% | $15,648.87 | $15,325.31 | 2.11% |
| KYLE | 1.50% | $826,924.71 | $792,204.99 | 4.38% | $7,374,288.52 | $6,531,156.54 | 12.90% |
| MOUNTAIN CITY | 1.00% | $1,538.24 | $1,755.70 | -12.38% | $22,719.60 | $11,895.88 | 90.98% |
| NIEDERWALD | 1.00% | $4,998.13 | $5,131.63 | -2.60% | $48,476.58 | $36,393.87 | 33.19% |
| SAN MARCOS | 1.50% | $4,046,009.85 | $2,705,777.38 | 49.53% | $37,448,055.03 | $28,532,454.71 | 31.24% |
| UHLAND | 1.50% | $35,135.78 | $23,496.11 | 49.53% | $223,148.67 | $170,982.84 | 30.50% |
| WIMBERLEY | 1.00% | $87,102.14 | $71,107.78 | 22.49% | $809,825.37 | $710,863.99 | 13.92% |
| WOODCREEK | 1.00% | $9,676.41 | $5,018.76 | 92.80% | $60,633.99 | $44,545.99 | 36.11% |
| HAYS COUNTY | 0.50% | $2,418,059.09 | $1,832,426.26 | 31.95% | $21,605,690.11 | $17,289,741.81 | 24.96% |
Up 100%!
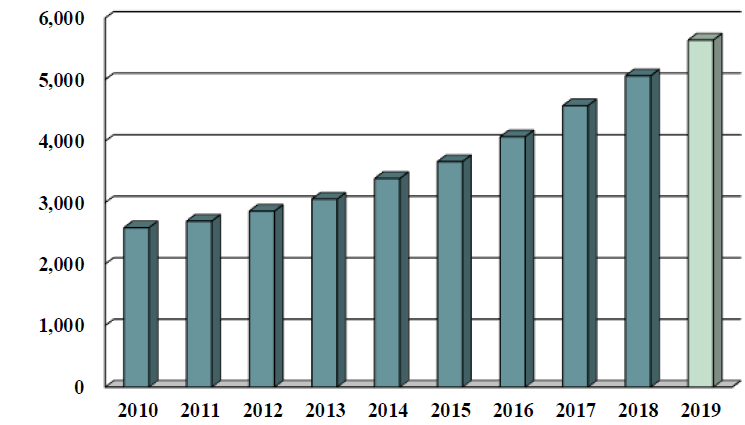
The City of San Marcos 10-Year Annual
Sales Tax Collection Up Over 100%
NOTE: The amounts and percentages below come directly from the City of San Marcos Finance Department and are the exact same amounts the city reported for last year’s 2019 budget.
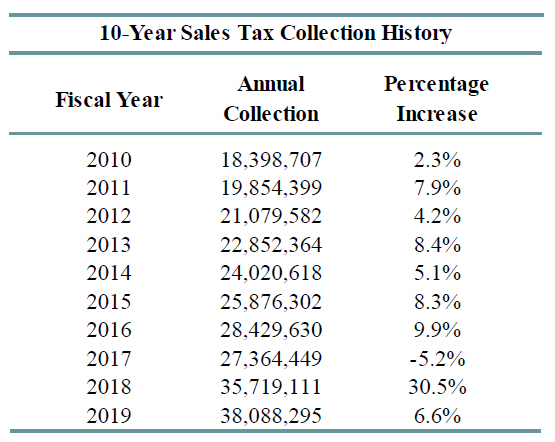
Sales taxes represent 44.4% of the total General Fund revenues, they represent the greatest single source of revenue for the General Fund.
Any excess collection above the fiscal year 2020 estimate will go directly into the General Fund balance or the budget can be amended to allocate these amounts.
The City of San Marcos collects one and one-half cents on every dollar spent on taxable goods and services within the city limits.
The State of Texas allows home-rule cities like San Marcos to adopt a one-cent sales tax to support general governmental services.
Local voters authorized another half-cent in 1987 dedicated solely to the reduction of property taxes.
The one and one-half cents collected by the City represents the maximum they may adopt.
The half-cent sales tax alone is expected to generate $11,906,000 in the next fiscal year, a sum that is equivalent to 23.52 cents on the property tax rate.
According to the city, without the half-cent sales tax dedicated to property tax reduction, the city’s ad valorem tax rate would have to be 23.52 cents more, or 84.91 cents per $100 of assessed value, to support the programs and services provided to San Marcos residents.
Sales taxes represent 44.4% of total General Fund revenue projected for the fiscal year 2020.
Sales tax receipts are the largest single revenue source supporting general governmental services in San Marcos. Consistent retail sales have kept this revenue stream steady for the past several years.
When comparing historical sales tax collections by segment, the percentage represented by retail collections has decreased while other segments have increased, indicating a small diversification in the sales taxes produced in the City.
It is important to note that sales tax revenues are a volatile funding source and are subject to shifts in local, state, and national economies.
•
Up 100%!
10-Year Appraisal Roll History For San Marcos Is Up Over 100%
(*per property & per tax year)
The FY 2020 budget will raise more total property taxes than last year’s budget by $3,609,774 OR 11.7 percent and of that amount $815,568 is tax revenue to be raised from new property added to the roll this year.
AUGUST 2020
| RECIPIENT | AUG 2020 ALLOCATIONS | CHANGE FROM AUG 2019 |
YEAR TO DATE CHANGE |
| CITIES | $495.2MM | -4.8% | 0.2% |
| TRANSIT SYSTEMS | $163.9M | -3.2% | -1.5% |
| COUNTIES | $46.1M | -9.4% | -0.9% |
| SPECIAL PURPOSE TAXING DISTRICTS | $60.1M | -1.8% | 5.4% |
| TOTAL | $765.3M | -4.5% | 0.1% |
.
• Last 12 Months of Sales Tax Reports •
.
• Definitions •
- Net Payment This Period— The actual payment amount sent to the entity.
- Comparable Payment Prior Year— The actual payment amount sent to the entity in the same month or quarter last year.
- Percentage Change— The percentage change in the actual payment amount sent this month compared with the payment amount sent in the same month last year.
- Payment YTD— The total amount of payments sent during the current calendar year to date.
- Prior Year Payments to Date— The total amount of payments sent during the same period for the previous calendar year to date.
- Prior-Year Payment YTD— The total amount of payments sent during the same period of the previous calendar year to date.
- Percentage Change— The percentage change in the total amount of payments sent during the current calendar year to date compared with the amount of payments sent during the same period for the previous calendar year to date.
Sources: State of Texas Comptroller and City of San Marcos FY 19 & 20 Budget


