

Latest Texas Economic Indicators
Texas economic indicators were mixed in December. The state finished 2018 with strong job growth and continued labor market tightness, but forward-looking indicators suggest that the state’s economic outlook has softened.
The leading index dipped for the third month, and the Dallas Fed’s 2019 employment forecast shows slower growth than the state’s long-run average.
The Texas Business Outlook Surveys suggest that current output growth slowed, and firm sentiment about broader economic conditions and company outlooks deteriorated.
z
z
Texas employment expanded an annualized 2.5 percent in December, bringing 2018 growth to 2.4 percent, or 298,219 jobs (Chart 1).
The Dallas Fed’s Texas Employment Forecast predicts 1.1 percent job growth in 2019 (December/December), with an 80 percent confidence band of -0.5 percent to 2.7 percent.
The forecast growth rate is well below the state’s long-run (January 1990-December 2018) growth rate of 2.1 percent.
The Texas unemployment rate held steady for the third straight month at 3.7 percent in December, while the U.S. rate ticked up to 3.9 percent. Both are well below their long-run averages, indicating continued labor market tightness.
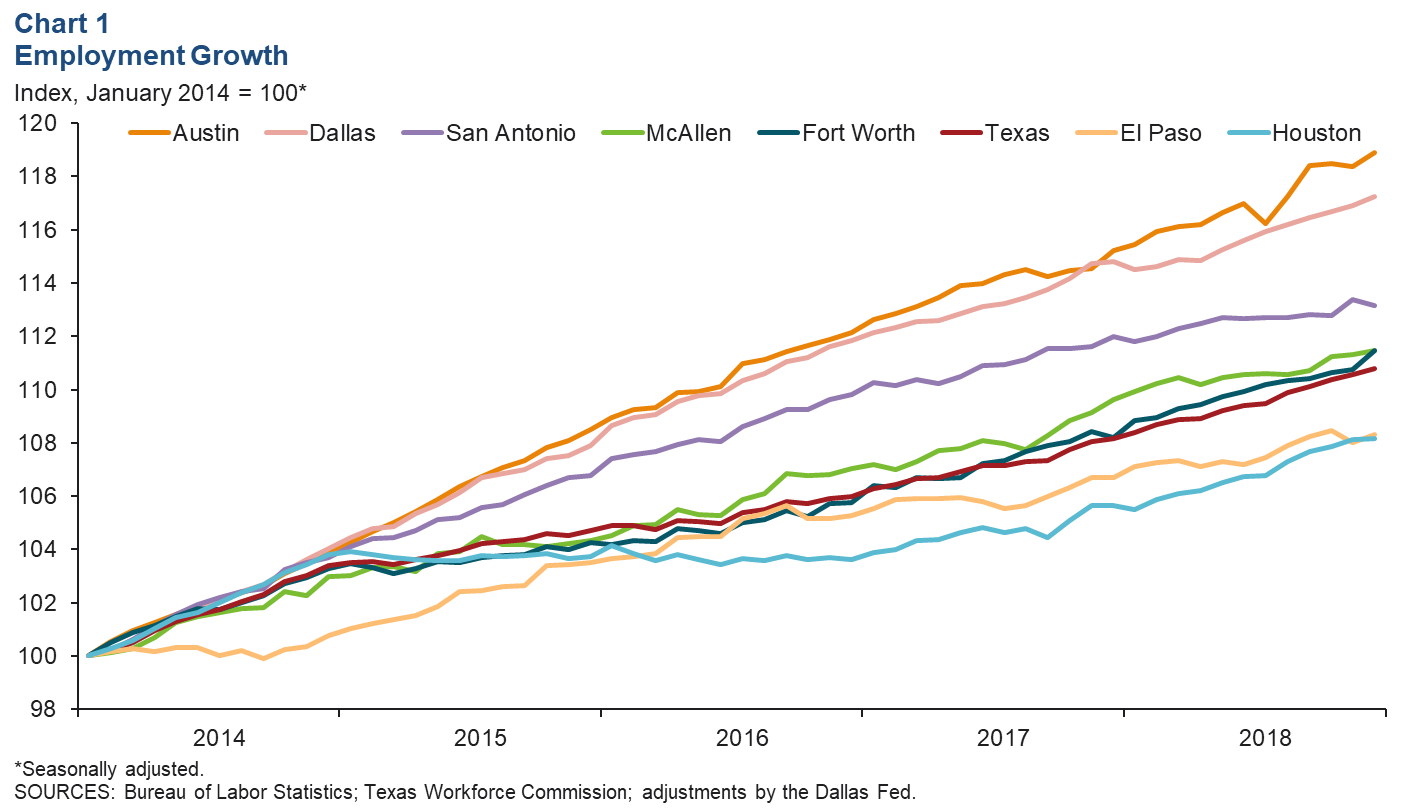

All major metros except San Antonio added jobs in December, and employment expanded in all the metros in the fourth quarter.
Austin had the fastest employment growth in 2018 at 3.2 percent, followed by Fort Worth (3.0 percent), Houston (2.4 percent) and Dallas (2.1 percent). San Antonio’s 1.0 percent growth was the slowest among the major metros.
Solid growth in December was buoyed by a 20.1 percent expansion in oil and gas extraction employment, the fastest among the state’s major sectors, followed by other services at 9.8 percent and education and health services at 7.9 percent.
However, the information; trade, transportation and utilities; and professional and business services sectors shed jobs. Government employment was flat in 2018, but all other sectors added to payrolls last year, led by oil and gas extraction’s 9.6 percent expansion.
z
z
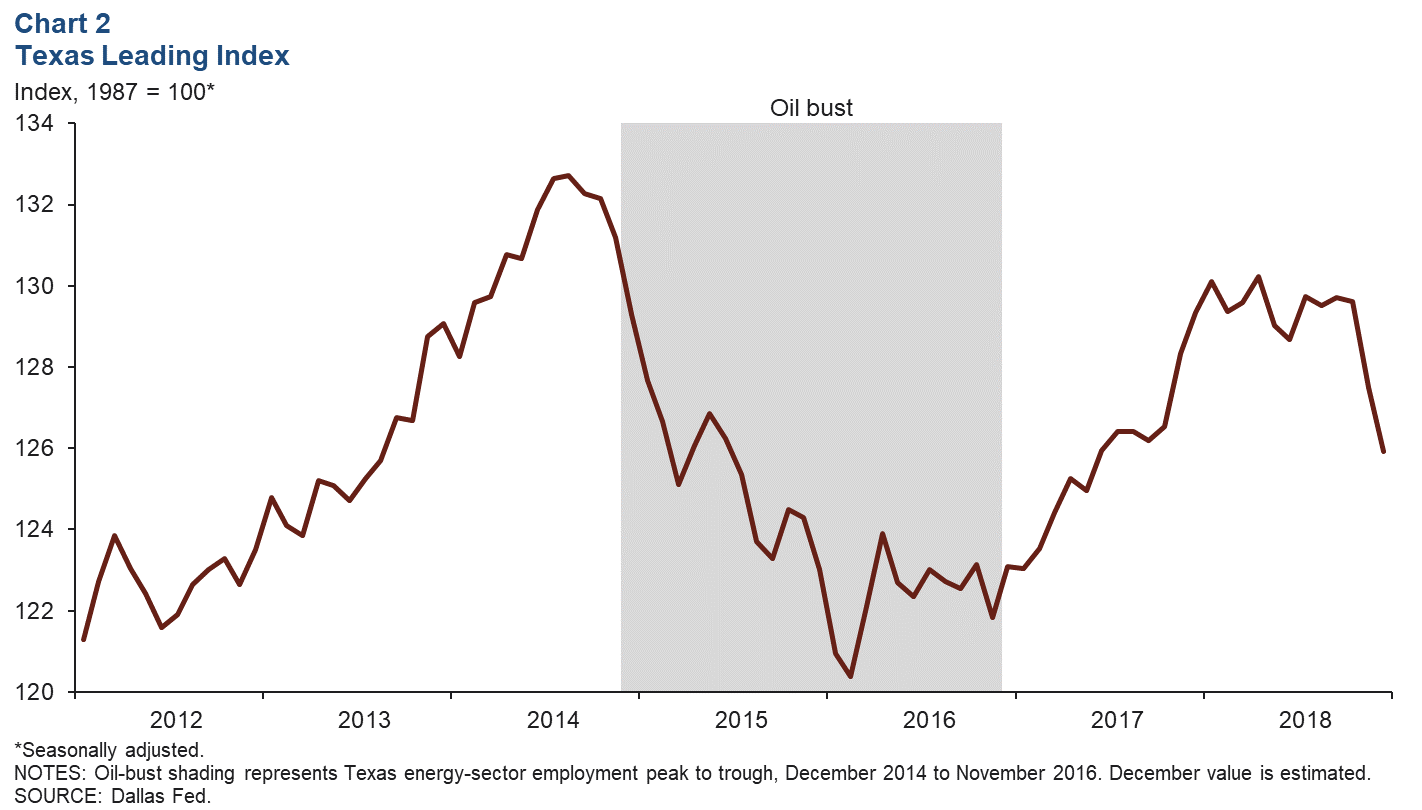
The Texas Leading Index, a composite of eight indicators that tend to change direction before the overall economy does, sheds light on the future of the state’s economy.
In December, the estimated value of the index dipped 1.2 percent, marking the third month of decline (Chart 2).
The Texas stock index was the largest drag on the index in December, while the help-wanted index was the most significant positive contributor.
z
z
Firms Report Deteriorating Business Conditions
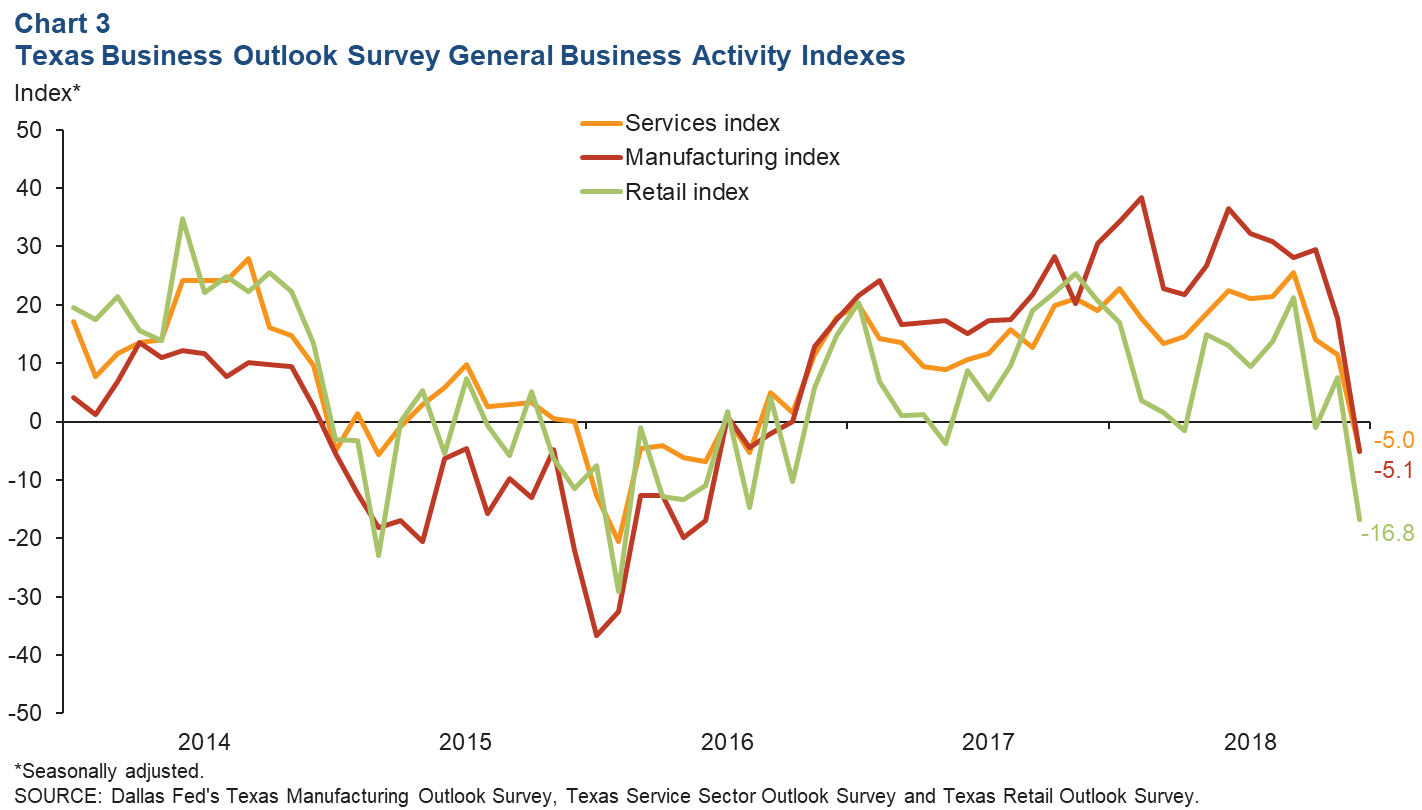
The Dallas Fed’s business outlook surveys pointed to worsening business conditions in December (Chart 3).
The general business activity indexes in the manufacturing, services and retail surveys fell into negative territory, suggesting that business sentiment has weakened.
The headline indexes of the three surveys remained positive but declined, suggesting deceleration in manufacturing production, service sector revenue, and retail sales growth.
z
z
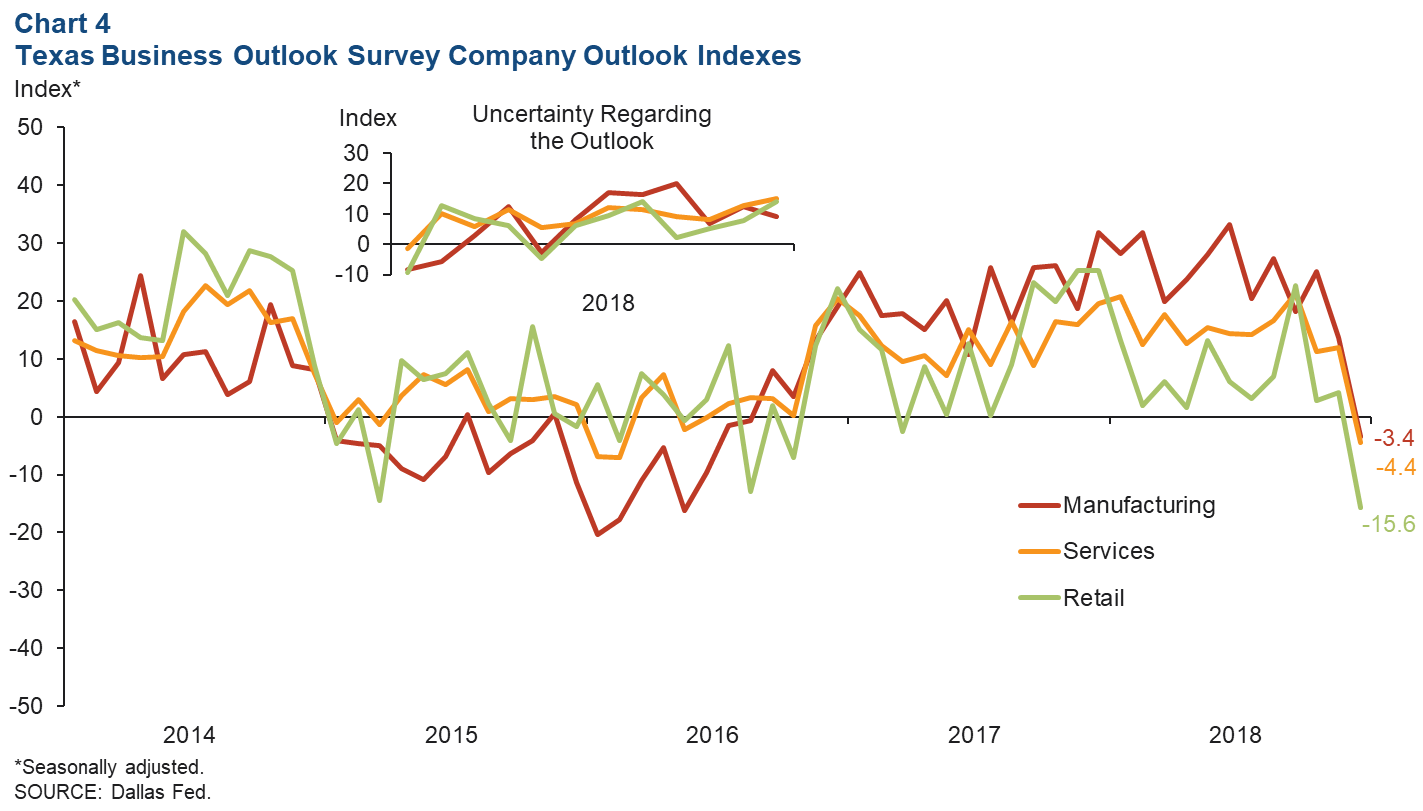
Firms across the three surveys also reported worsening company outlooks in December (Chart 4). All three company outlook indexes turned negative, with the more volatile retail index falling the most.
The services and retail sector uncertainty indexes rose as a larger share of firms reported increased uncertainty regarding their company outlooks, while the manufacturing uncertainty index dipped but remained positive.
z
z
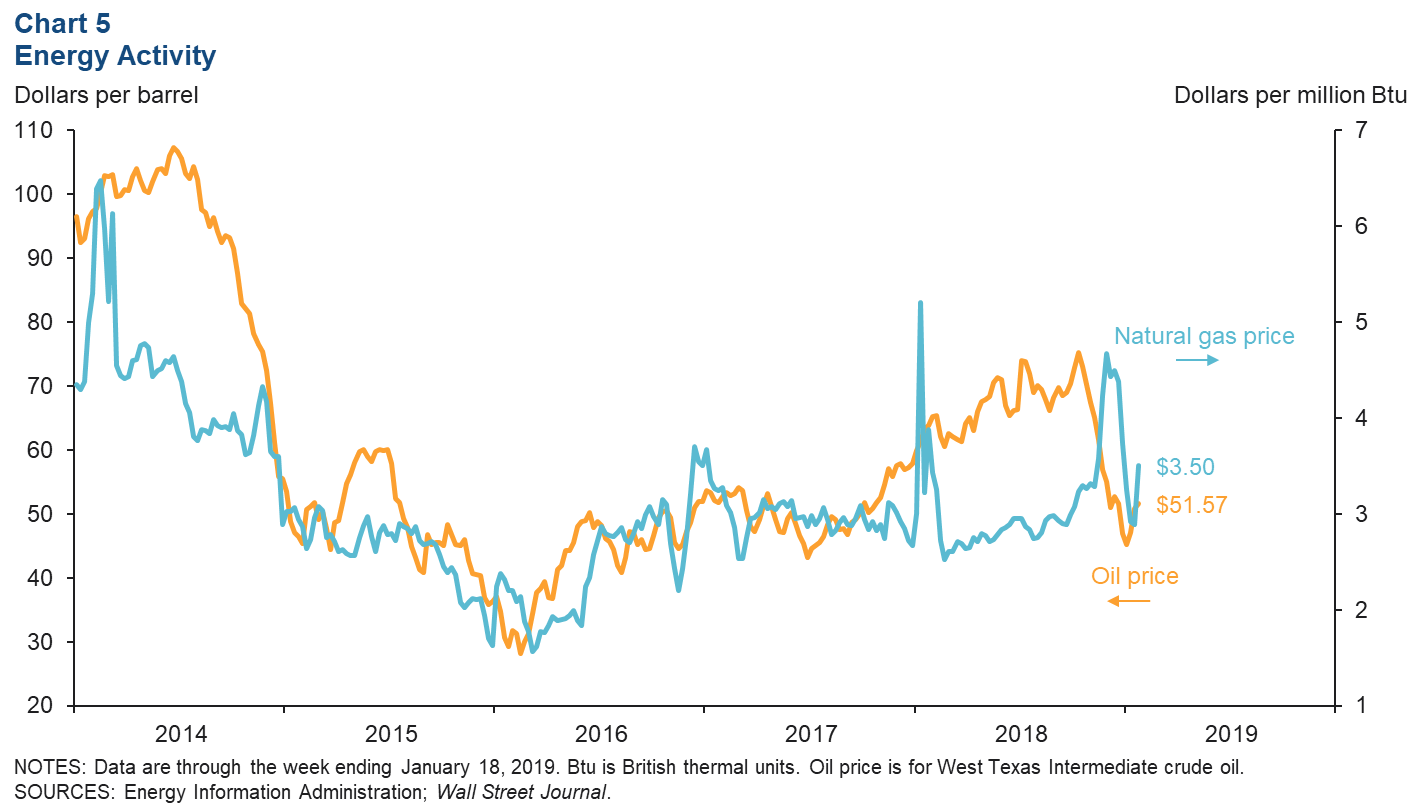
Oil prices rose 1.6 percent to $51.57 in the week ending Jan. 18, marking the third week of recovery after plummeting 39.8 percent from their October high (Chart 5).
Natural gas prices rebounded to $3.50 during the week, following five successive weeks of decline that reduced prices 35.6 percent.
The rig count contracted by 11 in the week ending Jan. 18 after remaining largely flat in recent months.
z
z
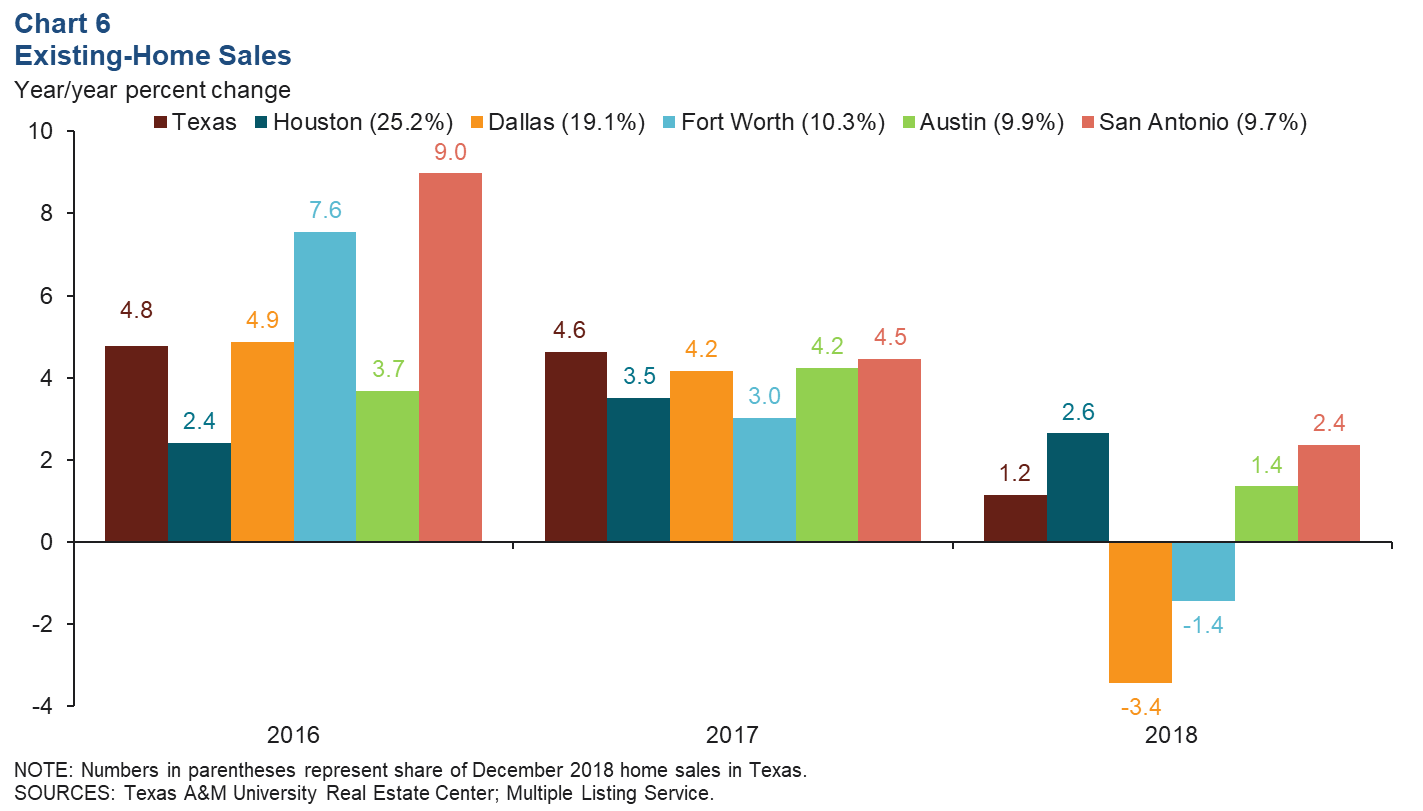
Texas’ existing-home sales inched up 0.4 percent in December, but the five-month moving average edged down 0.2 percent. Existing-home sales were up 1.2 percent in 2018 compared with 2017 (Chart 6).
Houston, the state’s largest market, recorded a 2.6 percent increase, followed by San Antonio’s 2.4 percent and Austin’s 1.4 percent growth. Dallas’ existing-home sales were 3.4 percent lower in 2018 than in the previous year, and Fort Worth sales were down 1.4 percent.
Source: Federal Reserve Bank of Dallas.


