
Position As Top Exporting State Exposes Texas To Shifting Trade Policy
As the nation’s No. 1 exporting state, Texas enjoys a strong position in world trade, benefiting from its comparative advantage in energy related manufacturing and intermediate goods exports…
By Jesus Cañas and Stephanie Gullo
Texas is the nation’s largest exporting state. With about $260 billion worth of goods exported annually over the past decade, the state has become a powerhouse that benefits from a central geographical location as well as accessible sea and land ports.
Texas exports have soared since the end of the oil bust in late 2016, driven by a large increase in both the volume and price of oil and natural gas exports. Moreover, since 2000, the state has derived 67 percent of its export growth from manufacturing.
However, the state’s comparative advantage in the global marketplace has come under growing pressure. A shift in U.S. trade and tariff regulations threatens to directly and indirectly contribute to increasing costs for many leading Texas export sectors that could benefit competitors.
Accounting for 19 percent of U.S. exports, Texas leads California, with a 10.7 percent share, and New York at 4.9 percent in 2018.1
Texas’ annualized 6 percent growth in exports is almost double the U.S. annualized 3.6 percent growth since 2000 (Chart 1).
Texas is one of the nation’s manufacturing hubs, belying lore of the state as an epicenter of cowboys and cattle. Texas represents 8.4 percent of U.S. gross domestic product, but 9.4 percent of U.S. manufacturing output, second only to California’s 13.6 percent share.

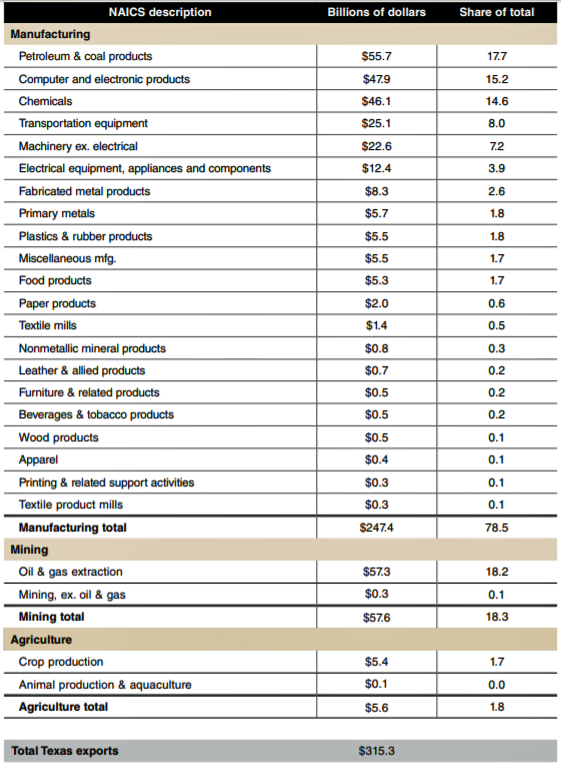
Thus, it is not surprising that the bulk of goods exports from Texas, 78.5 percent, in 2018 were manufactured goods.
Texas is also the top producer of oil and gas in the country, responsible for more than 4.7 million barrels of oil per day and 22.5 trillion cubic feet of gas. After the removal of a long standing federal crude oil export ban in 2015, these exports have boomed.
Oil and gas represents 18 percent of the state’s total goods exports. By comparison, agricultural and ranching products—including corn, cotton, wheat and soybeans—account for 2 percent.2
Manufacturing Across Metros
Houston is a leader in energy-related manufacturing, including machinery and fabricated metal manufacturing and petrochemicals.3
Dallas and Austin are the computer and electronic components manufacturing centers of the state, while San Antonio and Fort Worth specialize in transportation equipment manufacturing. Fort Worth also boasts a concentration of machinery and fabricated metals production.
Texas offers a central location within North America, a flexible labor market, a low cost of living and an attractive business environment.4 In addition, Texas shares a border with four of Mexico’s most industrialized states.
This proximity to Mexico has likely helped Texas manufacturing improve productivity and remain competitive in a globalizing business environment.
Texas accounts for 1.6 percent of overall world exports, well above the global market share of other U.S. states. The state ranks second in per capita manufacturing exports behind Louisiana.
Diversified Products, Destinations
Manufactured goods accounted for the largest share of the state’s exports, 78.5 percent, last year (Table 1). Petroleum and coal products was Texas’ No. 1 manufacturing export sector, at $55.7 billion and 17.7 percent of the total.
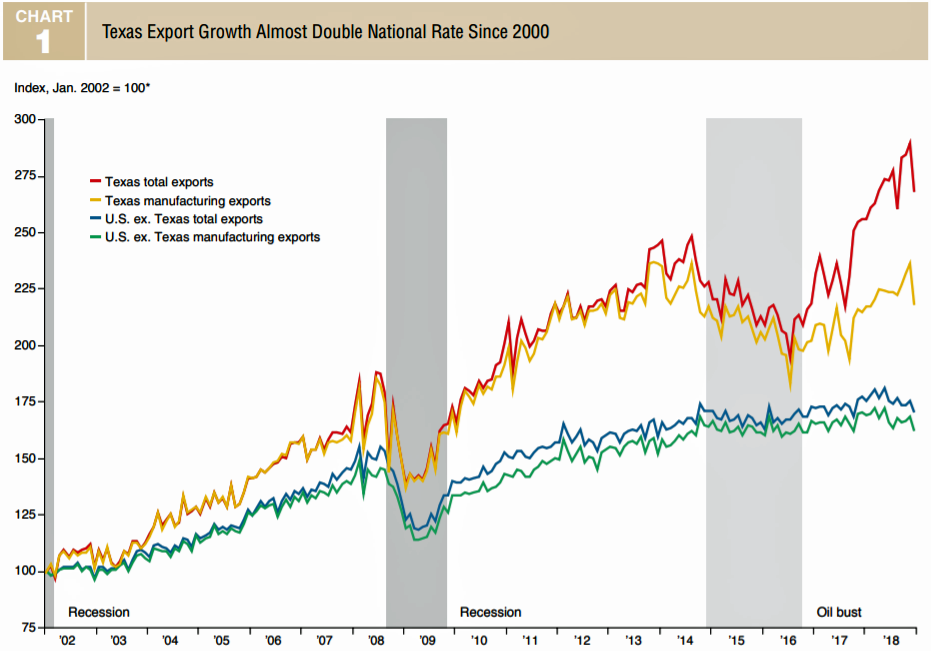
*Real dollars, seasonally adjusted. NOTES : Data are through December 2018. Recession shading refers to Texas recessions; oil bust shading refers to peak to trough of Texas oil and gas employment. SOURCES: Census Bureau; Bureau of Labor Statistics; Texas Workforce Commission; Federal Reserve Bank of Dallas.
Computer and electronic products ($47.9 billion/15.2 percent share) and chemicals ($46.1 billion/14.6 percent share) followed.
Transportation equipment and machinery rounded out the top five. These five sectors together represented 62.6 percent of the total.
The second-largest export sector was mining—largely oil and gas—at 18.3 percent of exports. Oil and gas and oil-dependent manufactured goods (petroleum and coal products and chemicals) together make up over half of Texas exports.
Mexico was Texas’ No. 1 export destination, receiving 34.8 percent of the state’s exports, notably computer and electronic products (23 percent), petroleum and coal products (19 percent) and transportation equipment (10 percent).
The state’s No. 2 market destination, Canada, received 8.7 percent of Texas’ exports, followed by China at 5.3 percent.
By region, Asia was the second biggest destination (25.7 percent of exports), followed by Europe (14.4 percent) and Latin America, excluding Mexico (13.7 percent).
Global Comparative Advantage
Comparative advantage refers to potential gains from trade arising from differences in resources or technology that allow a given country to produce a particular good at a lower cost.
The revealed comparative advantage (RCA) index, which measures the relative advantage or disadvantage of a country by industry based on that country’s export mix, is a widely used method to quantify comparative advantage.
The RCA index is the ratio of two shares: The numerator is a specific good’s share of a country’s total exports, while the denominator is the share of the same good relative to total world exports.
A country has a comparative advantage in a good if its RCA exceeds 1, and it has a comparative disadvantage if the RCA is below 1.
The logic behind RCA is that a country will have a higher share of global exports of a specific good if it has a comparative advantage producing it.
The same methodology can be applied to states. If the RCA for a Texas good exceeds 1, Texas’ export share of the product is higher than the world’s corresponding share, indicating a comparatively more concentrated production of the item in Texas.
The 17 industries with RCAs greater than 1.1—indicative of a clear competitive advantage—represent two-thirds of Texas’ total manufacturing exports (Chart 2).
As expected, Texas shows a manufacturing edge in energy-related products; the industry with the highest RCAs is petroleum and coal products.
The resin, synthetic rubber, and fibers and filaments industry and basic chemicals round out the top three.
Petroleum products manufacturing is the transformation of crude oil into usable products.
Typically, it involves the refining of petroleum into gasoline and diesel.
It also includes the production of asphalt coatings and lubricating oils.
Basic chemicals manufacturing is the production of petrochemicals such as ethylene, propylene and butadiene—the latter used to make synthetic rubber.
Texas, as the main trade intermediary between the U.S. and Mexico, holds a comparative advantage in intermediate goods exports.5
Computer equipment and aerospace products and parts have high RCAs and significant export shares. Computer equipment manufacturing includes computers, peripherals and communications equipment as well as intermediate components such as capacitors and resistors.
Companies in the aerospace products and parts manufacturing industry produce aircraft, aircraft components, missiles and space vehicles.
Texas also has a comparative advantage in producing motor vehicle parts, fabricated metals, engines and machinery.
Competing with Asia, Europe
RCAs help to identify countries and states with similar comparative advantages, which tend to be direct competitors for export market share. The countries exhibiting RCA patterns that best resemble those of Texas are its likely competitors.6
Based on that assumption, Table 2 shows Texas’ top five competitors in global manufacturing markets and their top products vis-á-vis the state.
Texas competes in manufacturing exports mainly with Asian countries—Japan, Korea and Singapore—followed by Germany and Israel. Texas competes head to head with Asian countries in industrial machinery, electrical and computer components, and motor vehicle parts.
In general, Texas, Germany and Israel vie for market share in the control instruments (transmitters, Ethernet equipment), power transmission, electrical equipment and plastic products industries.
Over the past decade, Japan has topped the list of competitors, while Korea has moved up to second place and Singapore has slid to third. Germany and Israel have recently gained relevance as Texas competitors.
Trade Uncertainty, Tariff Impacts
Economists agree that trade has a net positive effect on economic output.
However, opening markets to trade remains controversial largely because of its short-term distributional effects, which often bestow a relatively small benefit on a large number of consumers while harming a small number of workers by a large amount.
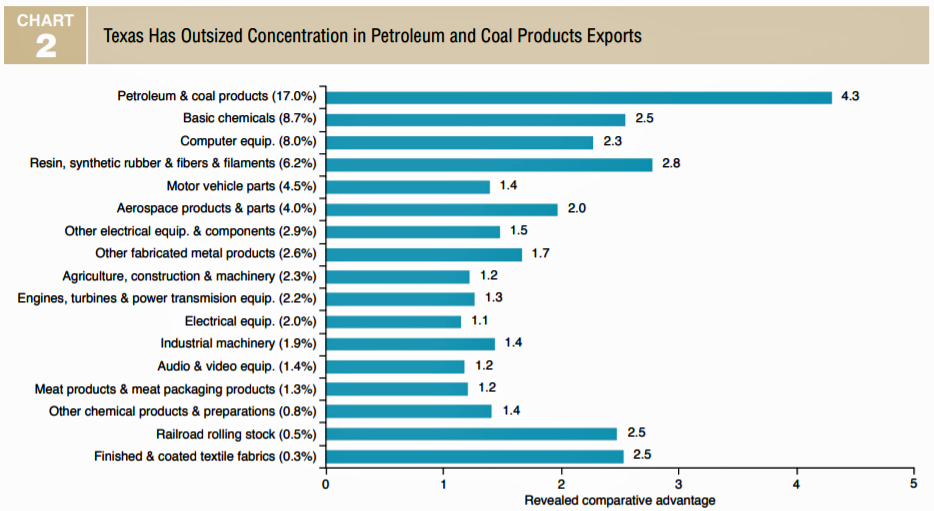
NOTES: The revealed comparative advantage (RCA) index is a measure an entity has in a specific industry that indicates its relative strength; shown are all industries with an RCA greater than 1.1 (indicating a comparative advantage) in 2016. Numbers in parentheses are the share of Texas exports in 2016. SOURCES: Census Bureau; UN Comtrade; authors’ calculations.
For Texas, trade openness has been favorable on net given that Texas exports have thrived, particularly since implementation of the North American Free Trade Agreement (NAFTA) in 1994.7
Texas intermediate goods exports gained global competitiveness due to the state’s proximity to Mexico’s maquiladora industry, the backbone of U.S.–Mexico intra-industry trade. Conversely, disrupting the U.S.– Mexico trade relationship could adversely affect Texas manufacturing’s world market standing.
For example, the recently renegotiated (though not ratified) redo of NAFTA—dubbed the U.S.–Mexico–Canada Agreement— proposes stricter rules of origin for the automotive sector along with higher wage requirements that together would likely raise production costs and reduce the competitiveness of motor vehicle parts exports.
Tariff increases involving electronic components imported from China diminish the competitiveness of the computer and electronic products industry. Tech product manufacturers use China-made components, whose cost has increased as much as 25 percent.
Tariffs make it harder for Texas to compete for market share against Japan, Korea and Singapore, which may be utilizing the same electronics supply chain, absent the tariff.
Steel and aluminum tariffs directly disrupt Texas manufacturing. Metal fabrication, for example, frequently involves welding, cutting, forming and machining pipes and perforation tools destined for the oil and gas industry.
Texas’ eighth-largest export is fabricated metals, and additional tariff costs could be passed on to petroleum products firms that depend on now costlier infrastructure.
Additionally, steel and aluminum tariffs render equipment makers in industrial, agricultural and construction machinery industries less competitive when facing Germany and Israel in the global arena.
Retaliatory tariffs imposed on U.S. goods sent abroad present another cost. In total, retaliatory tariffs have been applied on more than $120 billion worth of goods, representing around 8 percent of U.S. exports.8
The future direction of Texas manufacturing exports hinges on trade policy. The state is poised to draw further benefit from its location and resources, gaining market share worldwide in its industries of comparative advantage.
However, disadvantageous trade policies could cause the state to lose ground to its competitors, perhaps curbing manufacturing employment and the state’s prosperity.
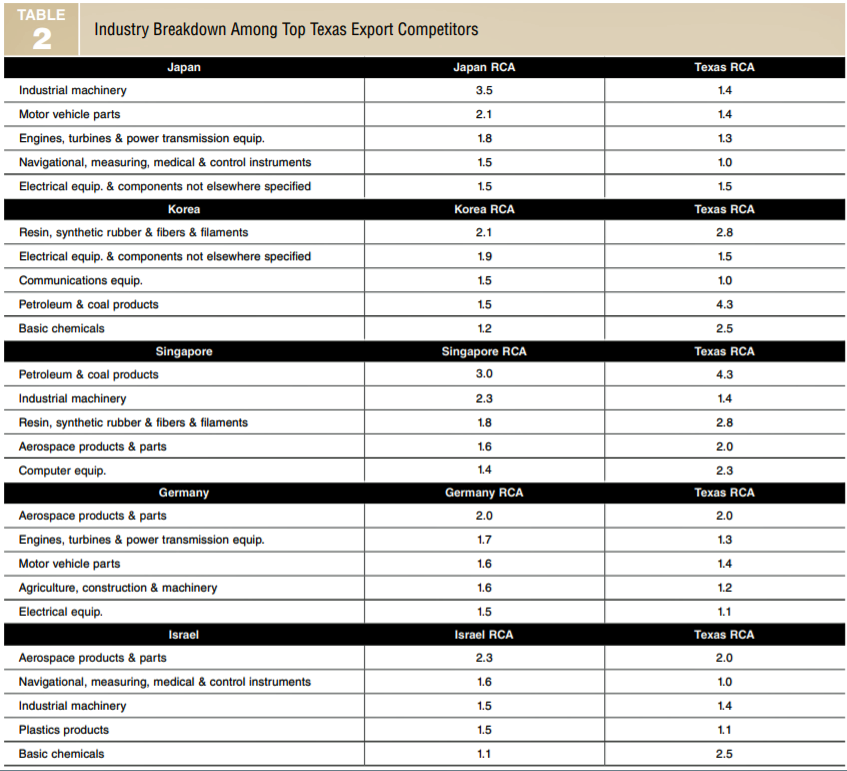
NOTES: Countries shown are Texas’ top five 2016 competitors. RCA refers to revealed comparative advantage index, a measure an entity has in a specific industry. Only industries that make up over 1 percent of Texas exports and that have 2016 RCAs greater than 1 for both the country and Texas are included. Among these industries, each country’s top five industries by 2016 RCA are shown. SOURCES: Census Bureau; UN Comtrade; authors’ calculations.
Cañas is a senior business economist and Gullo is a research analyst in the Research Department at the Federal Reserve Bank of Dallas.
Notes
1 Exports are measured by origin of movement, or the state from which the merchandise starts its journey to a port of export. For example, goods produced in Chicago and sent directly for export through the port of Houston are measured as Illinois’ exports, but if the same goods are first sent to a warehouse in Dallas for further processing or packaging, they would be considered Texas exports. For more information, see “State Export Data: Origin of Movement vs. Origin of Production,” by Andrew J. Cassey, Journal of Economic and Social Measurement, vol. 34, no. 4, 2009, pp. 241–68.
2 Trade in services represents 34 percent of U.S. exports but isn’t discussed here because data by state are unavailable.
3 “At the Heart of Texas: Cities’ Industry Clusters Drive Growth,” Federal Reserve Bank of Dallas Special Report, second edition, December 2018.
4 Ten-Gallon Economy: Sizing up Texas’ Economic Growth, by Pia M. Orrenius, Jesus Cañas and Michael Weiss, eds., New York: Palgrave MacMillan, 2015.
5 See “Intra-Industry Trade with Mexico May Aid U.S. Global Competitiveness,” by Jesus Cañas, Aldo Heffner and Jorge Herrera Hernández, Federal Reserve Bank of Dallas Southwest Economy, Second Quarter, 2017.
6 We compute Spearman’s rank correlation coefficients, which measure the strength of association between two ranked variables, involving Texas’ and each country’s RCA indexes for each manufacturing sector. For more information, see note 4, “Texas Comparative Advantage and Manufacturing Exports,” by Jesus Cañas, Luis Torres and Christina English, pp. 159–78.
7 See “Texas Border Cities Illustrate Benefits and Challenges of Trade,” by Jesus Cañas, Federal Reserve Bank of Dallas Southwest Economy, Fourth Quarter, 2016.
8 See “Which U.S. Communities Are Most Affected by Chinese, EU, and NAFTA Retaliatory Tariffs?” by Joseph Parilla and Max Bouchet, Brookings Institution, October 2018.


