
Inflation and the Economy: Steep rise in prices puts inflation in the spotlight
By Spencer Grubbs
Inflation is a word most of us don’t like to hear because it correlates to higher prices. But it is a normal economic phenomenon that generally goes unnoticed if kept in check — meaning prices increase slightly over time.
Such increases are a part of modern economic life and are necessary for economic growth. Inflation enters the spotlight only when it is abnormally high or low.
In recent months, inflation has grabbed our attention. Texas and the U.S. are experiencing the highest level of inflation since the early 1980s. Inflation puts pressure on everyone in tangible ways, but why it occurs may be less obvious to the average consumer.
Inflation Basics
Inflation is the rate of increase in prices over time. By one measure, it describes an increase in prices for specific items such as gasoline.
In April, the inflation rate for energy, which includes energy commodities and energy services, was up by 30 percent. Anyone who’s made a trip to the gas pump in recent months is familiar with some of these rising costs.
Typically, however, we define inflation more broadly to mean an increase in prices for everything, from housing and utilities to groceries and clothing. Prolonged periods of high inflation often result when an economy’s money supply grows faster (e.g., via stimulus checks, additional credit, more money being printed) than its ability to produce goods and services. As more money circulates, the value of a dollar diminishes, and prices rise to compensate.
JoJo Estrada, an economist for the Comptroller’s office, says that long periods of high inflation can have painful consequences. If left unchecked, the continued rise in prices erodes purchasing power.

On the other hand, taming inflation by raising interest rates can result in slower economic growth and increased unemployment.
Falling prices, or deflation, can be just as bad or worse for a country’s economy. Japan has experienced chronic deflation since the late 1990s, resulting in a stagnant economy and a decline in average nominal wages.
Falling prices reduce profits and force companies to lay off employees or abstain from raising employee pay.
Unemployment and sluggish wages, in turn, dampen consumer spending, which puts pressure on businesses to increase demand by lowering prices even more. This deflation-induced cycle is difficult to overcome.
So, what is the right amount of inflation? The Federal Reserve (the Fed), the central bank of the U.S., considers a 2 percent inflation rate in the long term “the most consistent with the [institution’s] mandate for maximum employment and price stability.” At this rate, inflation is low, stable, and predictable enough to encourage households and businesses to make sound spending and investment decisions — the linchpins of a healthy economy.
![]()
.
CALCULATING INFLATION
.
Government agencies survey households and businesses to identify and track the cost of a “basket” of commonly purchased items. There are two widely accepted methods of calculating inflation in the U.S.:
- The Consumer Price Index (CPI), released by the U.S. Bureau of Labor Statistics (BLS), is “a measure of the average change in the prices paid by urban consumers for a market basket of consumer goods and services.” The CPI uses data from a household survey administered by the U.S. Census Bureau called the Consumer Expenditure Survey.
- The Personal Consumption Expenditures Price Index (PCE), released by the U.S. Bureau of Economic Analysis (BEA), is “a measure of the prices that people living in the U.S., or those buying on their behalf, pay for goods and services.” The PCE uses business surveys (e.g., the U.S. Census Bureau’s Service Annual Survey) to better capture the change in prices for goods and services that consumers don’t pay for directly, such as medical care paid for by employers.
Sources: BLS (PDF); BEA
![]()
Inflation’s Long History
A prolonged period of inflation in the U.S. — dubbed the Great Inflation by the Fed — stretched nearly two decades, from 1965 through 1982. Inflation rose steadily from under 2 percent in 1965, increasing to 11 percent in 1974 and peaking at 13.6 percent in 1980 (Exhibit 1). At the core of the Great Inflation were numerous fiscal strains on the economy, including:
- Defense spending on the Vietnam War, which escalated in the 1960s and ended in 1975.
- Funding for new domestic social programs, such as Medicare and Medicaid, implemented by President Lyndon B. Johnson’s Great Society initiative.
- Multiple energy crises in the 1970s involving the Middle East that spurred oil price hikes.
Additionally, monetary policies put in place at the end of World War II proved unfavorable for controlling inflation or unemployment during this time.
The Fed financed ballooning federal budget deficits but did not aggressively target price stability, in contrast to its approach today. The result was an exorbitant supply of money and price volatility that forever changed our outlook on inflation.
.
EXHIBIT 1: YEAR-OVER-YEAR CHANGES IN INFLATION, 1965-1982
.
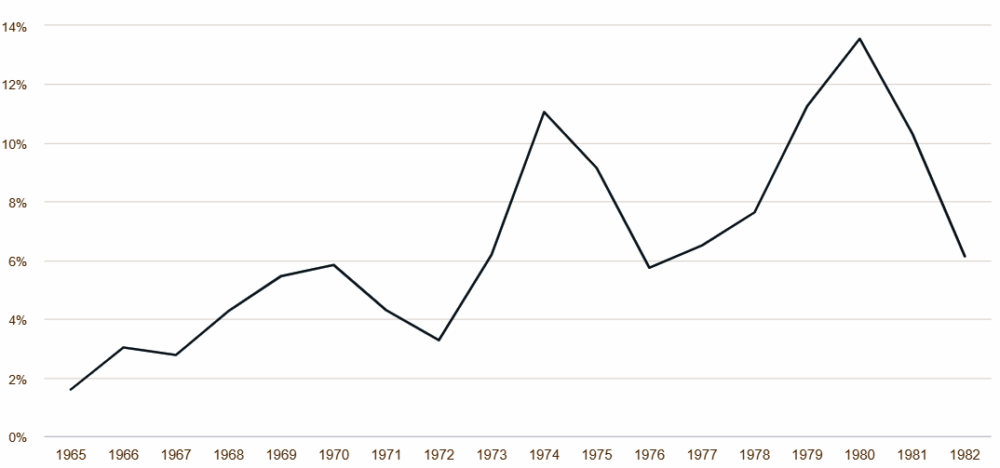
Source: Federal Reserve Bank of St. Louis
Inflation Today
The BLS estimates that inflation increased to 8.5 percent nationally in March 2022 — the highest year-over-year percent change in consumer prices since January 1982.
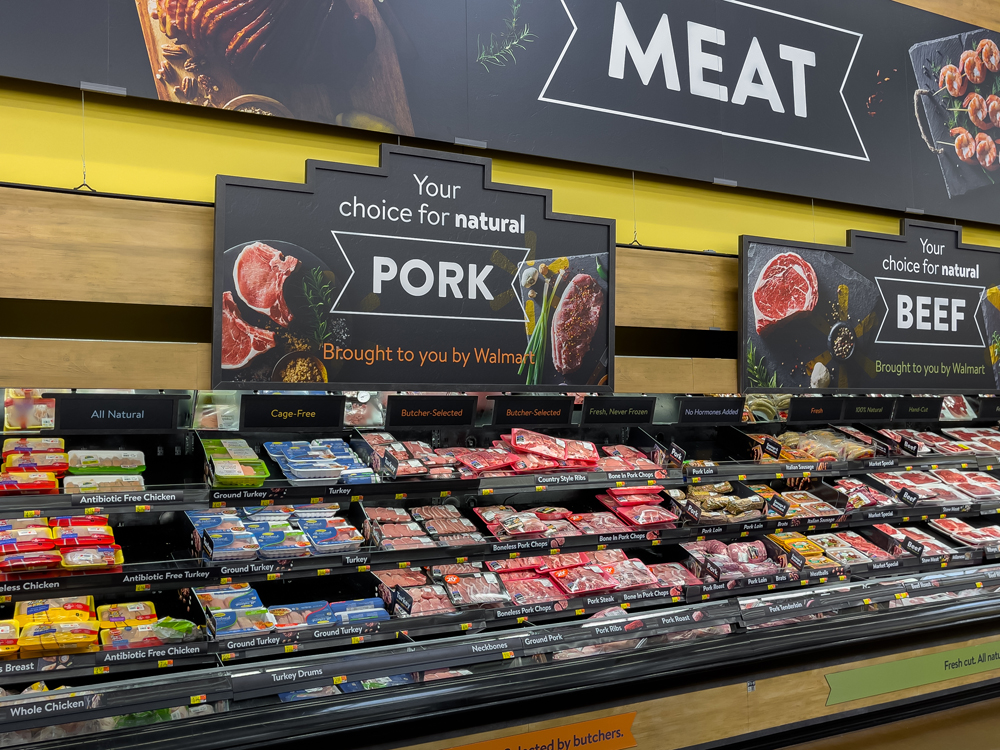
April brought only a slight decrease in inflation (Exhibit 2). The leading contributors to the overall inflation rate were food and energy. Meat, poultry, fish, and eggs — the largest source of food inflation — increased 14.3 percent since April 2021, the highest year-over-year percent change since the period ending May 1979.
The largest sources of energy inflation were gasoline and natural gas, rising nearly 48 percent and 22 percent, respectively.
.
EXHIBIT 2: INFLATION RATES BY MAJOR CATEGORIES IN THE U.S.,
APRIL 2021-APRIL 2022
.
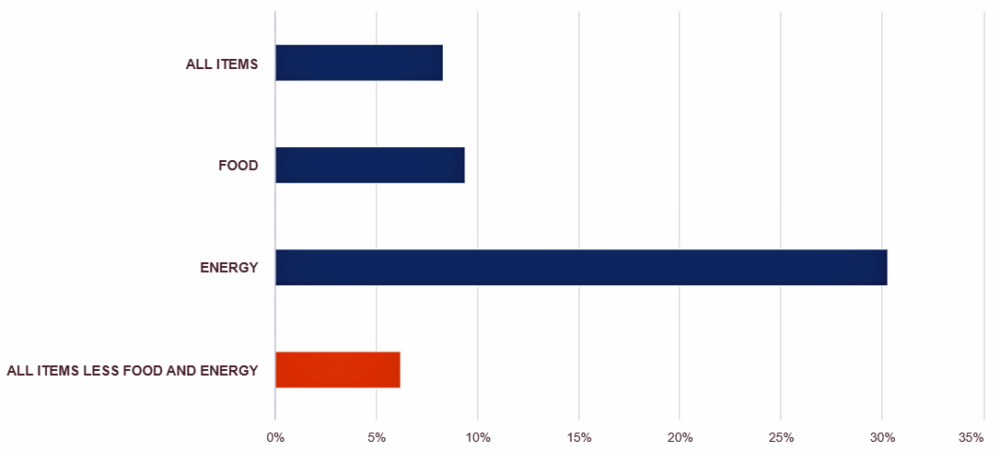
Source: BLS
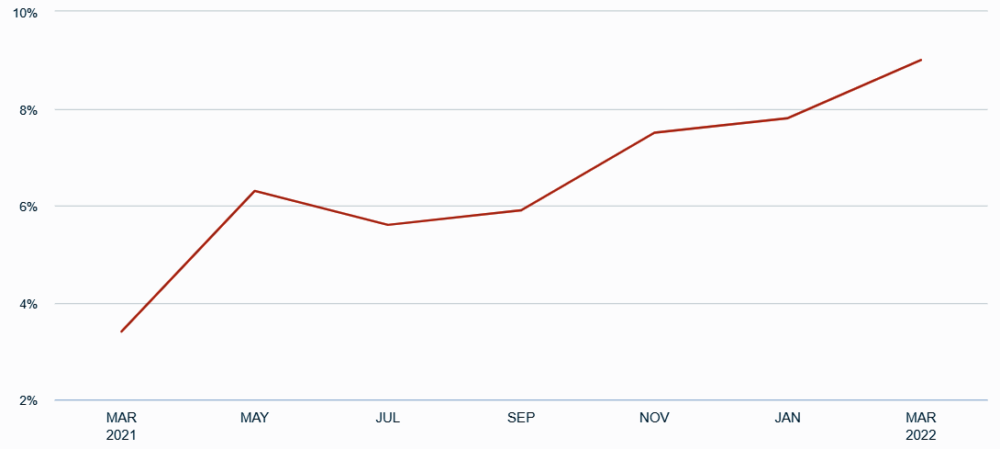
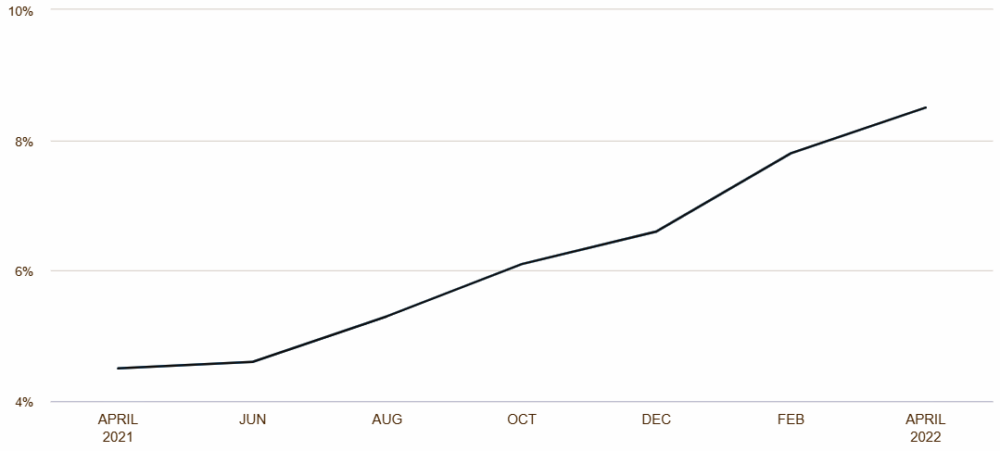
Regional data suggest that inflation in Texas parallels that of the country. BLS publishes CPIs specific to two major metro areas in Texas on a staggered, every-other-month schedule: Dallas-Fort Worth-Arlington and Houston-The Woodlands-Sugar Land.
Exhibit 3 shows that inflation in the state has been on the rise since mid-2021 and now is as high as 9 percent.
.
EXHIBIT 3: DALLAS-FORT WORTH-ARLINGTON, YEAR-OVER-YEAR PERCENT CHANGES IN INFLATION,
MARCH 2021-MARCH 2022
.
.
HOUSTON-THE WOODLANDS-SUGAR LAND, YEAR-OVER-YEAR PERCENT CHANGES IN INFLATION,
APRIL 2021-APRIL 2022
.
The Root Causes
What’s behind the recent uptick in prices? The best answer is a confluence of economic pressures related to the coronavirus pandemic stemming from both the supply side and the demand side.
On the supply side, the pandemic severely disrupted production and transportation lines along global supply chains or the networks between a company and its suppliers.
These disruptions have decreased the supply of intermediate goods — used in the assembly of final goods — thereby increasing the price of final goods. Projections indicate that supply chains may not fully recover until 2023.
On the demand side are stimulative fiscal and monetary policies undertaken by the federal government at the onset of the pandemic to stave off recession and mass unemployment.
In 2020, the Fed decreased interest rates, and the U.S. Congress authorized trillions of dollars in relief spending; these measures temporarily boosted demand and economic growth, but the economy now has reached a point where demand exceeds production capacity.
Early signs of inflation were dismissed by some policymakers as temporary or transient. They claimed that as relief dollars worked their way through the economy, inflationary pressures would subside, and prices would stabilize.
The thought that inflation might be transitory contributed to the decision by Fed policymakers to keep interest rates low and undercut a primary argument against additional federal spending. Unfortunately, inflation has proven anything but transient.
Moreover, Russia’s invasion of Ukraine has exacerbated inflationary pressures. Estrada explains:
The U.S. embargo on Russian oil is driving up the costs of producing a lot of goods, and in a number of circumstances, those extra costs are passed on to the final consumer. As far as Ukraine is concerned, the U.S. imported close to $1.9 billion worth of Ukrainian merchandise in 2021, or 0.06 percent of the total U.S. imports, 59 percent of which is from the primary metals manufacturing sector. In terms of exports from the U.S. to Ukraine, the U.S. exported over $2.5 billion worth of merchandise in 2021, or 0.1 percent of the total exports. Thirty percent of these exports were in the form of used or secondhand merchandise.
Inflation Inequality
Household spending on basic needs — housing, food, transportation, health care, and clothing — varies by income level. According to the BLS 2020 Consumer Expenditure Survey (PDF), total spending on basic needs increases in tandem with income.
High-income households spend more on essentials than low-income households. Low-income households, however, spend a much higher share of their budgets on basic needs (Exhibit 4). Research by the Hamilton Project (PDF), an economic policy initiative at the Brookings Institution, shows that these gaps have widened over time.
.
EXHIBIT 4: AVERAGE ANNUAL EXPENDITURES AS A PERCENTAGE OF AFTER-TAX INCOME, 2020
.
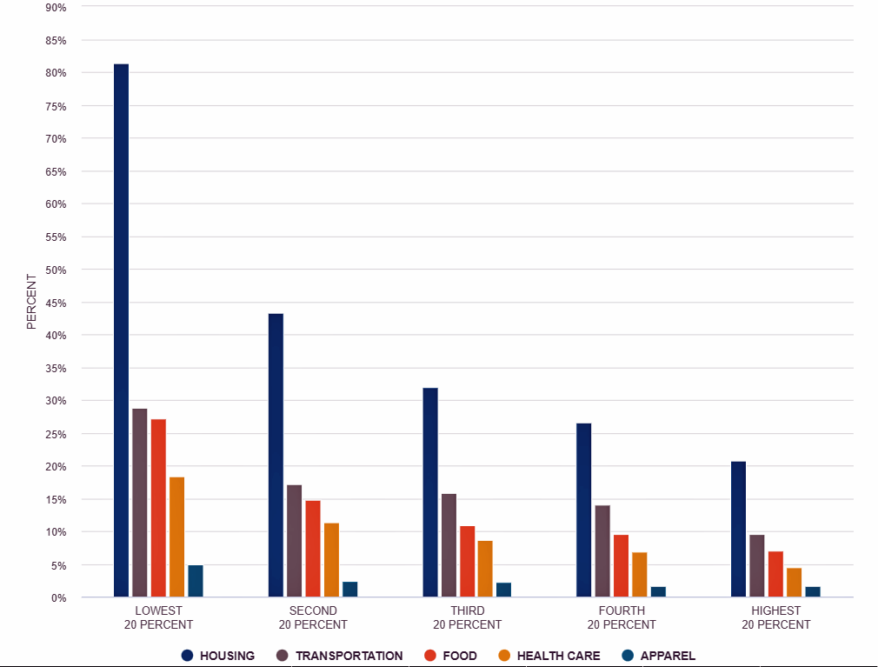
Source: BLS, Consumer Expenditure Survey 2020
“Inflation is going to affect everybody, irrespective of income level, but there’s such a thing called inflation inequality,” Estrada says. “For example, rather than buying the most expensive brand of dog food, high-income earners can start buying a cheaper generic version. Or if they have enough disposable income at hand and know that prices are rising, they can stock up on the brand that they want, which can cushion them from the immediate impact of inflation.”
Low-income households may already be purchasing the generic brand before the price increase, Estrada explains. Consequently, “they would either have to find some other generic that is cheaper, or even cut back on making such purchases.” Higher prices can force families living on tight budgets to make trade-offs between spending on one basic need versus another.
According to a recent CNBC poll, more than half of Americans surveyed (52 percent) feel they are under more financial stress than they were a year ago. Inflation has prompted Americans to change their spending habits over the past six months, such as cutting back on dining out (53 percent) and driving (39 percent).
Calming the Waters
On March 16, the Fed increased the federal funds rate by 0.25 percent and followed with a 0.5 percent increase on May 4. The Fed indicated that it anticipates further increases. The goal is to reduce demand for goods and services and eventually bring inflation back to the desired level of 2 percent.
The hikes, however, increase the cost of borrowing, which means Texans will pay more for credit card debt, car loans, and student loans.
Given the theoretical nature of monetary policy and the current precarious circumstances nationally and worldwide, it’s difficult to predict when inflation will subside.
Though the Fed is now taking action by tightening monetary policy and increasing interest rates, it may take several months for the changes to curb demand and cool inflation as intended. FN
To learn about gross domestic product and other economic health indicators, read Texas Comptroller’s February 2022 edition of Fiscal Notes. You also can see detailed projections for the state’s economy.


