

Monthly Energy Sector Update
![]()
According to the Dallas Federal Reserve, oil sector growth cooled at the end of 2018, and lower oil prices eroded expectations for capital spending in 2019. Natural gas exports remained near record levels in late 2018 even as domestic consumption rose due to winter weather and rising electric demand.
Employment
Initial estimates of Texas mining employment show growth moderating over the three months ending in November (Chart 1). Support activities for mining—mostly oilfield services companies and the more cyclical part of the industry—slowed to an annual growth rate of 9.4 percent (3,581 jobs).
Extraction—mostly exploration and production firms—fell 2.1 percent (-400 jobs). The slower growth was likely driven by limited pipeline capacity and flattening drilling and completion activity. The estimates are consistent with decelerating growth in the Dallas Fed Energy Survey’s Employment Index.
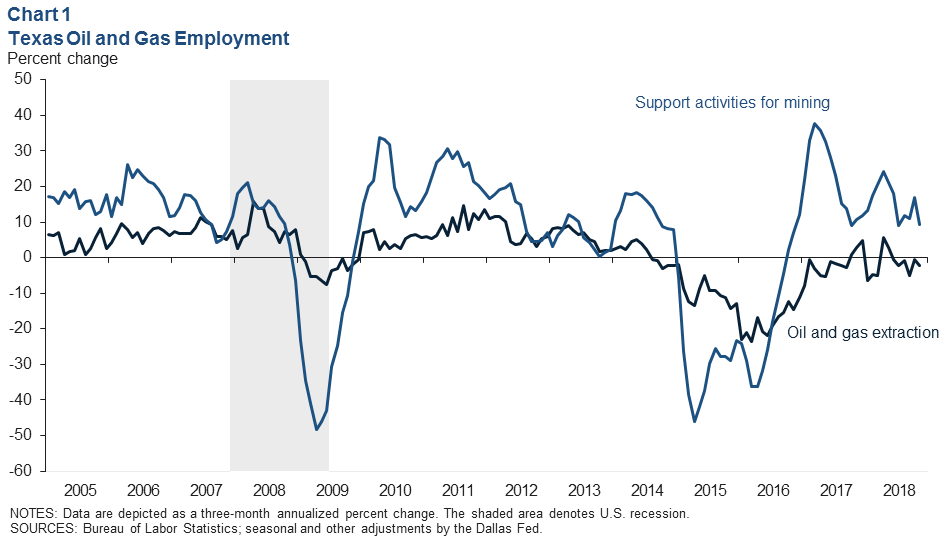
Outside of Texas, mining job growth was much more muted. Mining support activities growth was essentially flat at an annual rate of 0.1 percent for the three months ending in November. In stark contrast to in-state trends, extraction jobs (2,000) grew at a rate of 10.7 percent.
Prices

Oil prices fell further in December as international benchmark Brent crude slipped to $57 a barrel (Chart 2). Strong supply growth in the U.S., rising liquids inventories, waivers from U.S. sanctions for importers of Iranian crude, and uncertainty about the demand growth picture weighed on prices even after OPEC, Russia and Alberta (Canada) announced their intentions to cut production in 2019.
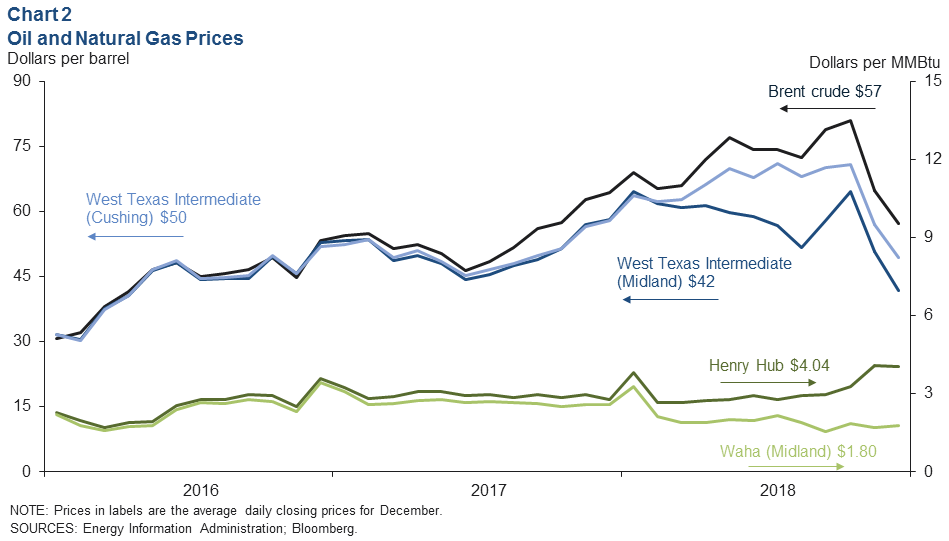
Crude priced in Midland fell in tandem with Brent to average $42 in December, over $14 below crude priced on the U.S. Gulf Coast (Magellan East Houston and Louisiana Light Sweet).
Limited takeaway capacity and surging production have kept prices at the wellhead depressed relative to global benchmarks, a condition expected to ease over 2019 as new pipelines are completed and come into service, particularly in the second half of the year.
Indeed, 46 percent of Energy Survey respondents listed “growing production” as their No. 1 objective in 2019 with new pipelines on the horizon.
Natural gas priced at Henry Hub held near $4 per million British thermal units in December thanks to winter demand, but natural gas in West Texas continues to be held down by the same forces affecting Midland crude: surging production amid limited takeaway capacity. Waha gas priced in Midland averaged $1.80 in December.
Planned Capital Spending
Fifty-three percent of oil and gas companies responding in the fourth-quarter Energy Survey said they had planned to increase capital spending at least slightly in 2019 compared with 2018, while 30 percent of firms planned to lower spending (Chart 3).
Those responses are congruent with reports from consulting firms such as Barclays, Wood Mackenzie and others that project an increase in energy industry capital expenditures in the U.S. this year.
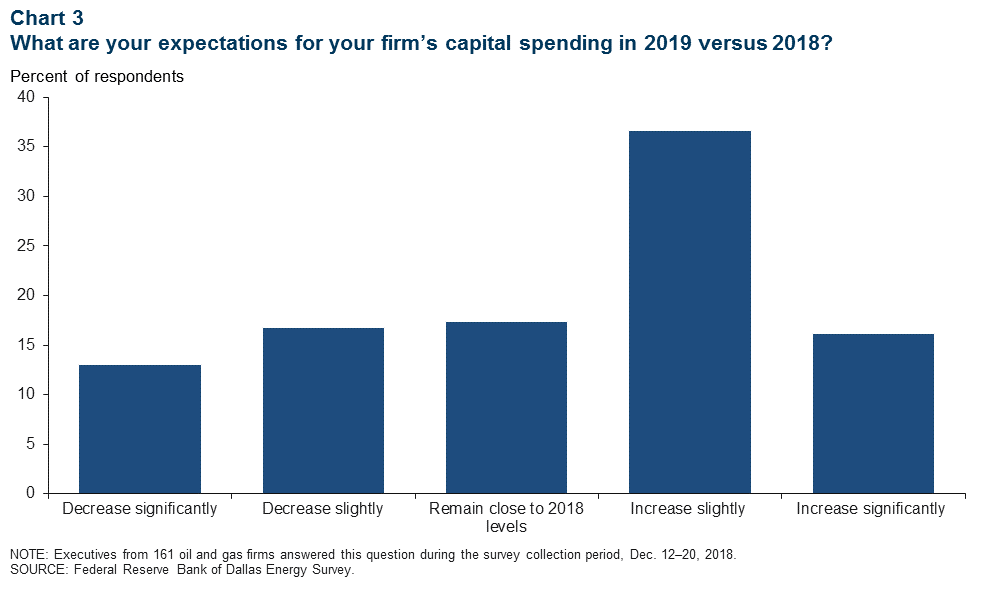
However, at the time of the survey, West Texas Intermediate crude (see Chart 2) had fallen below the average prices on which nearly 91 percent of respondents had based their capital planning.
This likely contributed to responses that the lower prices had caused them to reduce their expectations for their firm’s actual capital spending in 2019. If oil prices should stay near or below year-end levels in the weeks ahead, planned spending in 2019 may well be trimmed.
Exports of Natural Gas
The increased natural gas coming out of U.S. shale basins led to a surge in U.S. exports to near 10 billion cubic feet per day (bcf/d) from July to October—the highest export volume on record (Chart 4).
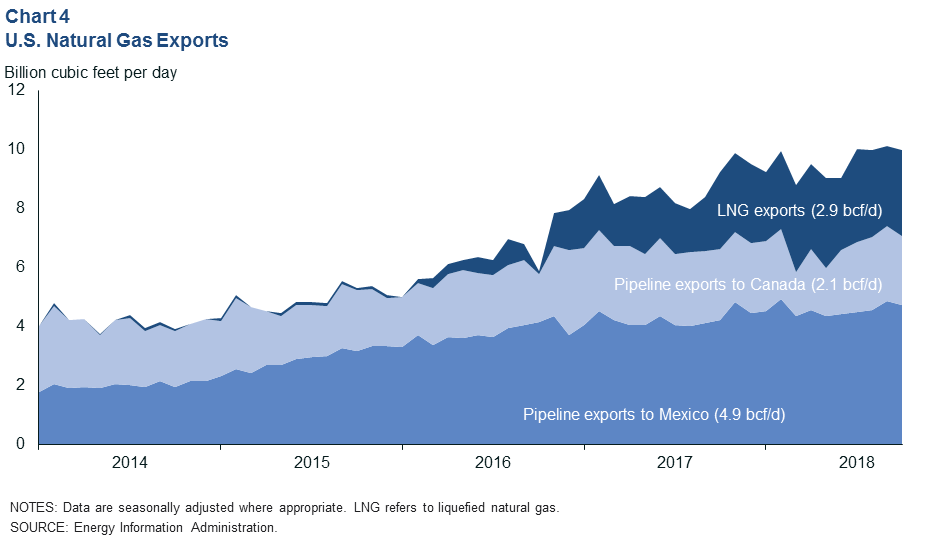
Pipeline exports to Mexico continued the upward trend of the past few years, reaching 4.9 bcf/d in October. As the volume of gas produced from oil wells in the Permian Basin grows, exports of natural gas (and natural gas liquids like propane) to Mexico will continue to increase, provided the transportation and distribution capacity to do so exists.
Pipeline exports to Canada dipped by nearly a third over the first quarter of 2018 but recovered to year-ago levels by the third quarter.
U.S. liquefied natural gas (LNG) exports logged another significant year of export growth in 2018. This was in spite of a sharp fall in shipments to China. Shipments to China had surged to 28 percent of all LNG exports in the fourth quarter of 2017, but the U.S.–China trade war eroded that exchange.
With zero shipments in September, China’s share of U.S. LNG exports fell to nearly 4 percent for the three months ending in October. U.S. gas exporters found ready consumers in Japan, Brazil and India, which saw big increases in shipment volumes in 2018.
Natural Gas Consumption
U.S. natural gas consumption rose significantly last year, driven by electric utilities that are increasingly turning to low-cost natural gas as fuel (Chart 5). Residential and commercial consumers (included in the “other” category) also increased consumption in 2018, fluctuating with the weather.
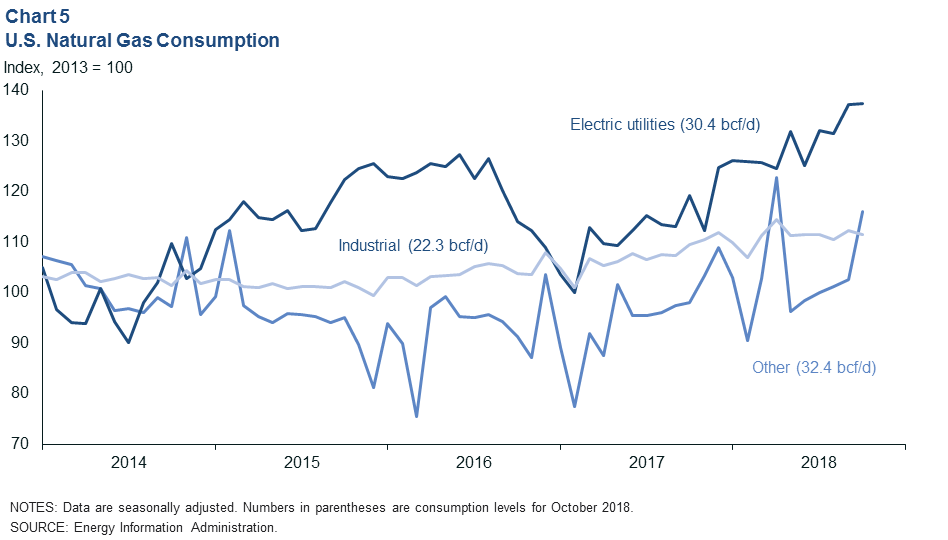
In October, the last month of data available, utilities consumed over 30 bcf/d of gas on a seasonally adjusted basis, or 36 percent of all consumption. “Other” sectors consumed another 32.4 bcf/d, or 38 percent. Industrial consumption was essentially flat after the first quarter.
U.S. Electricity Generation
The U.S. generated over 1,047 terawatt hours of electricity in third quarter 2018, 381.9 terawatts of which (36.5 percent, seasonally adjusted) were produced from burning natural gas (Chart 6).
That is the largest production share of electrons from natural gas since the data series began in January 2000 and is nearly double gas’ average market share from 2000 to 2009.
Increased gas consumption has come in part at the expense of coal, whose market share fell from as much as 55 percent during the past decade to as low as 26 percent in second quarter 2016. Coal accounted for 30 percent of production in third quarter 2018.
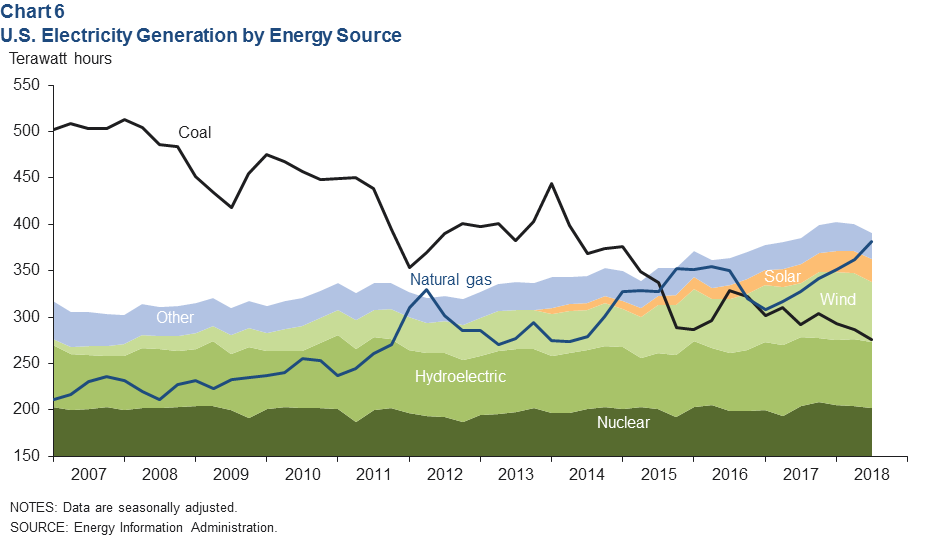
Outside of natural gas, wind and solar generation also gained market share. Wind provided 6.2 percent of U.S. electrons in third quarter 2018, and solar provided 2.4 percent.
The numbers may be small, but these renewables have logged significant growth.
Solar generation has grown at an average annual rate of 35 percent since the Energy Information Administration dataset began tracking it at the start of 2014, and wind output has grown at a rate of 8.3 percent over the same time.
Texas accounted for 29 percent of wind power generated in the third quarter and ranks as the largest state for wind production by far.
[divide icon_position=”left” width=”short” color=”#”]Source: Federal Reserve Bank of Dallas


