
Hays County, local municipalities receive over $7.8 million in combined monthly sales tax revenue
Corridor Staff
For the month of September, the state comptroller dispersed Hays County and the local government municipalities listed below received $7,892,718.07 million.
Sales taxes are a primary source of funds for many vital services ranging from police and fire protection to parks, recreation, library, environmental services, planning, and more.
The reliance on sales tax revenue requires vigilant monitoring of revenue sources to assure they will keep pace with the demands and rising costs while operating large complex budgets.
In the City of San Marcos, sales tax revenues represent 42.8% of the general fund budget and are the largest single revenue source supporting general government services and this is the same for nearly all cities across the state.
You can review more on the San Marcos budget, spending, and where your tax money goes below.
.
• MONTHLY COUNTY & MUNICIPAL RUNDOWN •
.
SEPTEMBER 2021 SALES TAX REVENUE
Local Central Texas Cities: $5,524,454.97
Hays County: $2,368,263.10
Combined Total: $7,892,718.07
These allocations are based on sales made in July by businesses that report tax monthly.
•
AUGUST 2021 Sales Tax Revenue
Local Central Texas Cities: $6,389,888.22
Hays County: $2,693,914.86
Combined Total: $9,083,803.08
*These allocations are based on sales made in June by businesses that report tax
monthly and on sales made in April, May, and June by quarterly filers.
Combined Year To Date Sales Tax Revenue
Local Central Texas Cities: $52,444,481.96
Hays County: $22,346,025.63
Countywide Combined Total: $74,790,507.59
*Year To Date: January-December calendar year
• MONTHLY COUNTY & MUNICIPAL BREAKDOWN •
Can’t see the whole table? Touch it and scroll right!
| CITY | RATE | NET PAYMENT THIS PERIOD | COMPARABLE PAYMENT PRIOR YEAR | % CHANGE |
PAYMENT YTD | % CHANGE |
| BUDA | 1.50% | $990,289.23 | $677,729.01 | 46.11% | $7,832,517.80 | 27.81% |
| DRIPPING SPRINGS | 1.25% | $332,448.55 | $271,517.15 | 22.44% | $2,823,125.64 | 21.83% |
| HAYS | 1.00% | $1,919.23 | $2,267.63 | -15.36% | $17,105.27 | 9.30% |
| KYLE | 1.50% | $1,031,882.07 | $826,924.71 | 24.78% | $9,103,011.12 | 23.44% |
| MOUNTAIN CITY | 1.00% | $2,122.37 | $1,538.24 | 37.97% | $18,749.16 | -17.47% |
| NIEDERWALD | 1.00% | $6,756.64 | $4,998.13 | 35.18% | $55,214.24 | 13.89% |
| SAN MARCOS | 1.50% | $2,979,042.73 | $4,046,009.85 | -26.37% | $31,127,094.10 | -16.87% |
| UHLAND | 1.50% | $64,981.51 | $35,135.78 | 84.94% | $452,020.61 | 102.56% |
| WIMBERLEY | 1.00% | $108,369.61 | $87,102.14 | 24.41% | $950,906.97 | 17.42% |
| WOODCREEK | 1.00% | $6,643.03 | $9,676.41 | -31.34% | $64,737.05 | 6.76% |
| HAYS COUNTY | 0.50% | $2,368,263.10 | $2,418,059.09 | -2.05% | $22,346,025.63 | 3.42% |
![]()
10-YEAR APPRAISAL ROLL
HISTORY FOR SAN MARCOS
The FY 2021 budget will raise more total property taxes than last year’s budget by $2,714,724 OR 7.9 percent.
Of that amount, $1,494,301 is tax revenue to be raised from new property added to the roll this year.
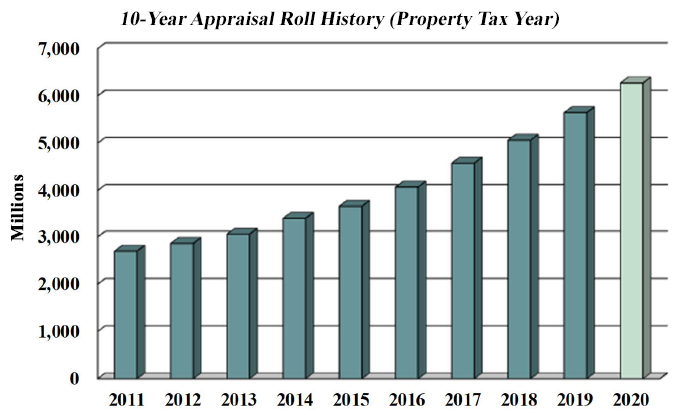
Whereas, last year’s budget, FY 2020 budget will raise more total property taxes than last year’s budget by $3,609,774 OR 11.7 percent.
And of that amount, $815,568 is tax revenue to be raised from new property added to the roll this year.
.
.
.
HOW THE FY 2021 NEW BUDGET WILL AFFECT YOUR PROPERTY TAX RATES
The fiscal year 2021 property tax levy will be used to pay debt service on outstanding General Fund obligations and support General Fund maintenance and operations.
Of the 59.30 cents per $100 of valuation levied, 17.36 cents goes to debt payments and 41.94 cents goes to maintenance and operations.
Operations include police and fire protection, park operations and maintenance, activity center, library, animal services, road maintenance, traffic control, and other general governmental functions.
General Fund obligations include certificate obligation bonds (COs) and voter-approved general obligation bonds (GOs) including the 2017 bond projects to renovate and expand the library, police headquarters renovations, two additional fire stations, and a fire training facility.
For fiscal year 2021, the city’s total property tax levy of $37.2 million is an increase of $2.6 million over the current tax year levy of $34.6 million, of that $1.5 million was revenue from new properties.
The adopted property tax rate of 59.30 cents is a decrease from the prior year’s adopted tax rate. The total valuation of all property increased by 11.7% or $628 million from the prior year.
The existing property consists of $6.0 billion and the new property makes up $251.9 million of total valuation.
In the fiscal year, 2021 citizen tax bills will reflect 59.30 cents per $100 of assessed property value. Based on this rate, an owner of a home value of $100,000 will pay approximately $593 in city property taxes.
The Hays County appraisal district assesses the real property values used to calculate property tax bills.
.
![]()
.
THE CITY OF SAN MARCOS 10-YEAR ANNUAL
SALES TAX COLLECTION & HOW IT’S USED
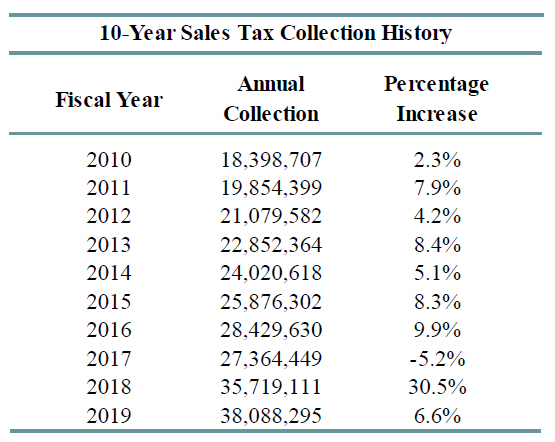
Sales taxes represent 42.8% of the total General Fund revenues, they represent the greatest single source of revenue for the General Fund.
Any excess collection above the fiscal year 2021 estimate will go directly into the General Fund balance or the budget can be amended to allocate these amounts.
The City of San Marcos collects one and one-half cents on every dollar spent on taxable goods and services within the city limits.
The State of Texas allows home-rule cities like San Marcos to adopt a one-cent sales tax to support general governmental services.
Local voters authorized another half-cent in 1987 dedicated solely to the reduction of property taxes.
The one and one-half cents collected by the City represents the maximum they may adopt.
The half-cent sales tax alone is expected to generate $11,906,000 in the next fiscal year, a sum that is equivalent to 23.52 cents on the property tax rate.
According to the city, without the half-cent sales tax dedicated to property tax reduction, the city’s ad valorem tax rate would have to be 23.52 cents more, or 84.91 cents per $100 of assessed value, to support the programs and services provided to San Marcos residents.
.
.![]()
CITY OF SAN MARCOS AVAILABLE BUDGETS
• COSM FY 2020 – 2021 Approved Budget ![]()
• COSM FY 2019 – 2020 Approved Budget ![]()
• COSM FY 2018 – 2019 Approved Budget ![]()
• COSM FY 2017 – 2018 Approved Budget ![]()
• COSM FY 2016 – 2017 Approved Budget ![]()
• COSM FY 2015 – 2016 Approved Budget ![]()
• COSM FY 2014 – 2015 Approved Budget ![]()
• COSM FY 2013 – 2014 Approved Budget ![]()
• COSM FY 2012 – 2013 Approved Budget ![]()
![]()
![]()
![]()
![]()


